Why the 10-Year Treasury Yield Matters More Than Ever
The 10-year Treasury yield isn’t just a number buried in a bond market report. It’s one of the most watched benchmarks in global finance. In 2025, as inflation pressures linger and the Federal Reserve continues to recalibrate its policy stance, the 10-year yield is shaping everything from mortgage rates to stock valuations.
Whether you’re a retail investor, corporate CFO, or real estate developer, the 10-year Treasury yield influences your world in profound and often underestimated ways. This in-depth guide will help you decode it.

What Is the 10-Year Treasury Yield?
The 10-year Treasury yield is the annualized return an investor earns by holding U.S. government debt over a decade. Considered a risk-free rate, it’s a core reference for everything from bond prices to loan interest rates. Movements in this yield often reflect expectations for:
- Inflation trends
- Federal Reserve interest rate policies
- Economic growth prospects
- Global capital flows
In 2025, the yield is a live reflection of market psychology about the future.
Current Trends (Updated May 2025)
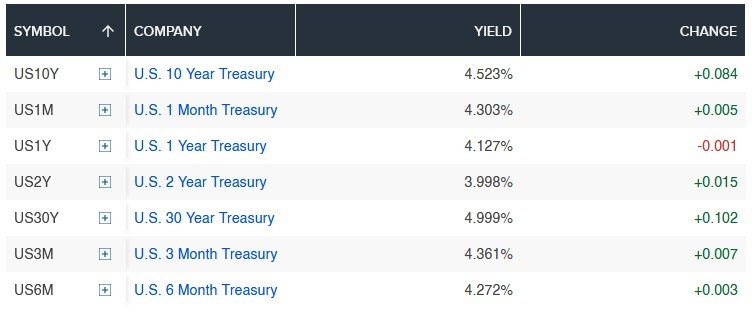
- Current yield: ~4.52% (as of May 2025)
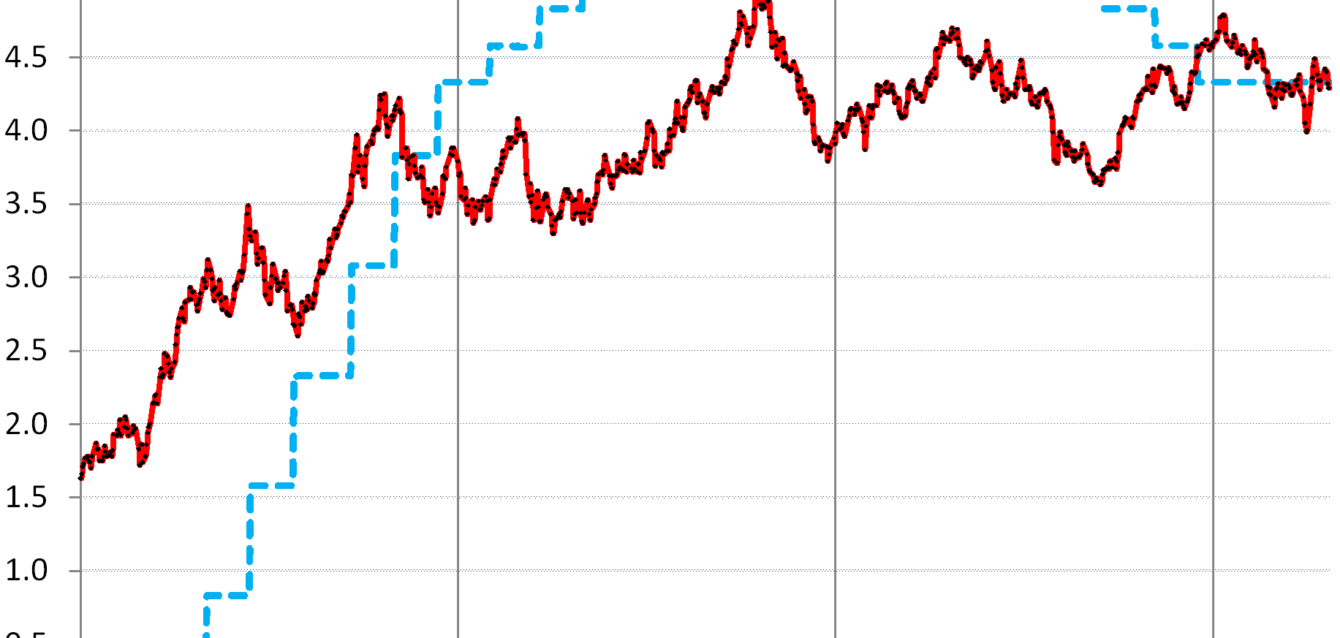
- YTD range: 3.96% – 4.88%
- Main drivers: Sticky inflation, labor market resilience, and reduced rate-cut expectations.
- Fed signals: Cautious neutrality; not committed to cuts yet.
Compared to last year, the 10-year yield has remained elevated despite slower CPI prints. This suggests investor skepticism about the Fed’s ability to bring inflation back to 2% without reigniting growth.
Historical Context: Is 4.5% High or Low?
Over the last 40 years, the 10-year Treasury yield has ranged from a high of over 15% in 1981 (Volcker era) to under 0.5% in 2020 (COVID crisis).
| Year | Avg 10Y Yield | Fed Funds Rate | Context |
|---|---|---|---|
| 2000 | 6.03% | 6.24% | Dot-com peak |
| 2010 | 3.22% | 0.18% | Post-GFC recovery |
| 2020 | 0.89% | 0.05% | Pandemic lockdown |
| 2023 | 3.91% | 5.00% | Peak rate hikes |
| 2025 | ~4.50% | 4.75% | Inflation normalization phase |
Why the 10-Year Yield Moves
Several interconnected factors drive changes in the 10-year yield:
- Inflation expectations – Higher inflation leads to higher yields as investors demand more compensation.
- Monetary policy – Hawkish Fed signals push yields up; dovish tones pull them down.
- Economic data – Strong GDP growth and low unemployment = higher yields.
- Bond supply/demand – More issuance or foreign selling can spike yields.
- Risk sentiment – In crisis periods, yields fall as investors flee to safety.
Impacts on Markets and Individuals
📉 Stock Market
Rising yields usually pressure growth stocks (especially tech), as future earnings are discounted at higher rates. Value stocks may benefit if tied to real economy.
🏠 Housing Market
Mortgage rates are directly influenced. A 10-year yield near 5% pushes 30-year mortgage rates to 7%+, reducing affordability and dampening home sales.
💳 Credit Markets
Corporate borrowing becomes more expensive. Junk bonds widen spreads as risk appetite falls.
💼 Businesses
Higher yields affect:
- Capital project viability
- Buyback economics
- Pension liabilities
2025 Forecasts: What Are Analysts Saying?
| Institution | 2025 Yield Target | Commentary |
| Goldman Sachs | 4.70% | Yield remains elevated on fiscal concerns and high real rates |
| Morgan Stanley | 4.25% | Predicts disinflation with soft landing |
| JPMorgan | 4.00% | Expects 2 Fed rate cuts starting Q4 |
| BlackRock | 5.00% | Cites structural inflation and deficit-driven issuance |
Market pricing (via CME FedWatch Tool) expects no rate cuts before Q3, anchoring yields above 4.3% in the near term.
How to Trade or Hedge Against Yield Movements
1. Bond ETFs
- Long: TLT (20+ Year Treasuries), IEF (7-10 Years)
- Short: TBF/TBT (inverse exposure to Treasuries)
2. Floating Rate Notes (FRNs)
Attractive if yields rise; adjust coupon every quarter.
3. Equity Sector Rotation
- Bearish yield trend: Go for utilities, staples, REITs
- Bullish yield trend: Prefer banks, insurers, energy
4. Commodities & Real Assets
Gold and oil often serve as partial hedges, especially during stagflation concerns.
Visualizing the Yield’s Ripple Effects
| Asset Class | Yield ⬆️ Impact | Yield ⬇️ Impact |
| Stocks | 📉 Tech, growth hit | 📈 Relief rally |
| Bonds | 📉 Price declines | 📈 Duration outperforms |
| Real estate | 📉 Slower sales | 📈 Mortgage relief |
| USD | 📈 Strengthens | 📉 Weakens |
Frequently Asked Questions (FAQ)
Q: Why is the 10-year Treasury yield important?
It influences borrowing costs, reflects economic sentiment, and serves as a benchmark for risk-free returns.
Q: Who sets the 10-year Treasury yield?
The market. It’s determined by auction demand and trading on the open market.
Q: What happens when the yield inverts with the 2-year?
An inverted yield curve often signals recession expectations.
Q: Should I adjust my investments based on the 10-year yield?
Yes, especially in fixed income and rate-sensitive equity sectors.
Q: How often does the yield change?
Daily, sometimes intra-day. It reacts quickly to Fed announcements and macro data.


