

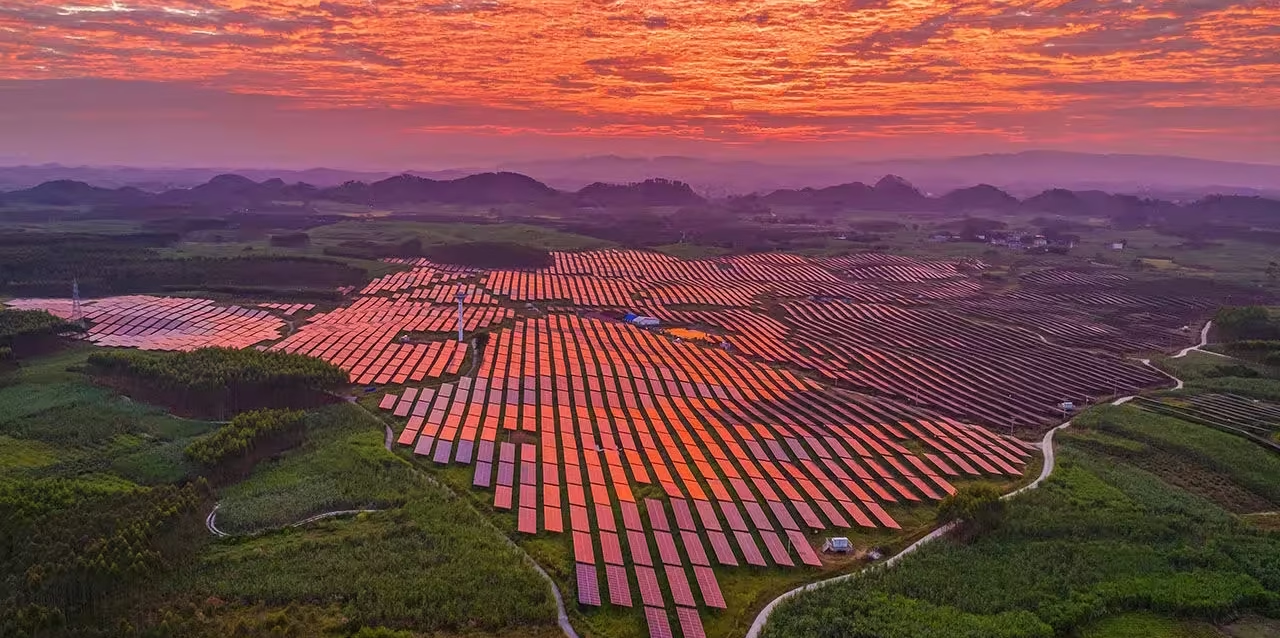
China Solar Industry Statistics 2026
By Axis Intelligence Research
Co-authors: Jennifer Miller & Mia Scarlett (Business and Filings Analysis) & Aidan Jad (EV & Clean Energy) | Last updated: September 17, 2026 | License: CC BY 4.0
China built 1,100 GW of solar module capacity and produced 620 GW of modules in 2025, according to the China Photovoltaic Industry Association (CPIA). Axis Intelligence Research calculates that the idle portion alone, 480 GW, equals 78.4% of the 612 GW the CPIA expects the entire world to install in 2026.
Quick Answer
China made 1.3 million tonnes of polysilicon, 680 GW of wafers, 660 GW of cells and 620 GW of modules in 2025 (CPIA via IEA PVPS). According to Axis Intelligence Research, the China Solar Overcapacity Index (CSOI) read 53.5 for 2025 and an estimated 64.1 on an annualized first-half 2026 basis: more than half of the country’s solar factory capacity is sitting idle.
Key Findings
- According to Axis Intelligence Research, China’s China Solar Overcapacity Index (CSOI) reached an estimated 64.1 in the first half of 2026, up from 53.5 in 2025.
- According to the CPIA, China produced 574.5 GW of the world’s 693.6 GW of solar modules in 2025, an 82.8% share calculated by Axis Intelligence Research.
- According to the National Energy Administration, China’s photovoltaic capacity reached 1,286 GW at the end of July 2026, overtaking coal power’s 1,285 GW for the first time.
- According to Ember, China exported a record 68 GW of solar wafers, cells and modules in March 2026, ahead of the April 1 removal of export VAT rebates.
- Axis Intelligence Research estimates that LONGi, JinkoSolar, JA and Trina Solar each lost between CNY 0.104 and CNY 0.123 per watt of modules shipped in the first half of 2026.
How Much Solar Does China Produce?
China remains the factory floor for nearly every solar panel installed on Earth. The CPIA’s year-end figures, published by the IEA Photovoltaic Power Systems Programme, put 2025 output at 1.3 million tonnes of polysilicon, 680 GW of wafers, 660 GW of cells and 620 GW of modules.
2026 is the year that number shrank. At its mid-year conference, the CPIA reported that China produced 538,000 tonnes of polysilicon in the first half of 2026 (down 9.8%), 293 GW of wafers (down 7.3%), 260.7 GW of cells (down 21.9%) and 201.3 GW of modules (down 35.1%), as reported by pv magazine.
China solar production by supply chain stage, 2025 vs H1 2026
| Stage | 2025 output | H1 2026 output | H1 2026 YoY change | Source |
|---|---|---|---|---|
| Polysilicon | 1.3 million t | 538,000 t | -9.8% | CPIA via IEA PVPS; CPIA via pv magazine |
| Wafers | 680 GW | 293 GW | -7.3% | CPIA |
| Cells | 660 GW | 260.7 GW | -21.9% | CPIA |
| Modules | 620 GW | 201.3 GW | -35.1% | CPIA |
Why two different 2025 module output figures exist
The CPIA publishes two numbers for 2025 module output, and we publish both rather than averaging them. The roadmap figure carried by IEA PVPS is 620 GW. A separate CPIA report on global manufacturing, reported by TaiyangNews in July 2026, puts China’s output at 574.5 GW, down 8.4%, against 693.6 GW globally. The second figure sits inside a self-consistent global dataset, so we use it for market share calculations and the first for stage-by-stage utilization, where it matches the CPIA’s capacity series.
Jennifer Miller’s read: Look at which number moved, and by how much. Module output fell 35.1% while polysilicon fell only 9.8%. The headline says the industry cut production; the stage-level data says it cut where cutting is cheap, at assembly, and kept the most expensive plants running. That is the detail that should slow a reader down before accepting “production is falling” as evidence that the surplus is clearing.
What Is China’s Solar Market Share?
According to the CPIA’s global capacity report, China produced 574.5 GW of the world’s 693.6 GW of modules in 2025. Axis Intelligence Research calculates that as an 82.8% share of global module output. On the capacity side, China held 1,089.4 GW of the world’s 1,430.2 GW of module lines, a 76.2% share.
The CPIA’s 14th Five-Year Plan review states China accounts for more than 80% of global production capacity in every segment of the chain. Concentration among manufacturers is also tightening at the top: the top five module makers raised their combined share by 0.8 percentage points to 48.2% in 2025, while the top ten slipped to 64.3%.
China share of global solar module manufacturing, 2025
| Metric | China | World | China share | Source |
|---|---|---|---|---|
| Module output | 574.5 GW | 693.6 GW | 82.8% | CPIA via TaiyangNews; share by Axis |
| Module capacity | 1,089.4 GW | 1,430.2 GW | 76.2% | CPIA via TaiyangNews; share by Axis |
| Top 5 makers’ share of global output | n/a | 48.2% | n/a | CPIA |
| Top 10 makers’ share of global output | n/a | 64.3% | n/a | CPIA |
The share of output (82.8%) running ahead of the share of capacity (76.2%) matters. It means Chinese lines, underused as they are, still run harder than the plants built elsewhere. China’s own module utilization in the same report works out to 52.7%, while the global average is dragged down further by factories outside China that the market has not bought from.
How Big Is China’s Solar Overcapacity?
This is the question buyers, trade negotiators and investors keep asking, and it deserves one number instead of four. So Axis Intelligence Research built one.
The China Solar Overcapacity Index (CSOI)
The China Solar Overcapacity Index (CSOI) measures the share of China’s solar manufacturing capacity left unused, averaged across the four core stages of the silicon supply chain. It runs from 0 (every line running) to 100 (every line idle).
Formula: CSOI = 0.25 × (idle polysilicon share) + 0.25 × (idle wafer share) + 0.25 × (idle cell share) + 0.25 × (idle module share), where each idle share = 1 − (output ÷ capacity), expressed in percent.
Inputs: end-2025 capacity from the CPIA’s 14th Five-Year Plan review (3.5 million tonnes of polysilicon, 1,500 GW of wafers, 1,400 GW of cells, 1,100 GW of modules) and 2025 output from the CPIA roadmap. Equal weights reflect that a surplus at any single stage is enough to depress prices down the chain.
CSOI reading by stage
| Stage | End-2025 capacity | 2025 output | Idle share 2025 | Idle share H1 2026 (annualized, est.) |
|---|---|---|---|---|
| Polysilicon | 3.5 million t | 1.3 million t | 62.9% | 69.3% |
| Wafers | 1,500 GW | 680 GW | 54.7% | 60.9% |
| Cells | 1,400 GW | 660 GW | 52.9% | 62.8% |
| Modules | 1,100 GW | 620 GW | 43.6% | 63.4% |
| CSOI | 53.5 | 64.1 (estimate) |
Source: CPIA capacity and output data; CSOI calculated by Axis Intelligence Research. The H1 2026 reading doubles first-half output and holds end-2025 capacity constant.
According to Axis Intelligence Research, the CSOI rose from 53.5 in 2025 to an estimated 64.1 on the annualized first-half 2026 figures. The index moved in the wrong direction despite a year of “anti-involution” policy, because output fell faster than capacity was retired.
Idle capacity in gigawatts
Converting the idle shares into physical capacity makes the scale clearer. According to Axis Intelligence Research, China had 480 GW of idle module capacity, 740 GW of idle cell capacity and 820 GW of idle wafer capacity at the end of 2025. The idle module lines alone equal 78.4% of the 612 GW of global installations the CPIA forecasts for 2026.
Inventory tells the same story upstream. EnergyTrend reported on September 10, 2026 that Chinese polysilicon stocks remained above 540,000 tonnes. Axis Intelligence Research estimates that is at least equal to the country’s entire first-half 2026 polysilicon output of 538,000 tonnes.
Jennifer Miller’s read: The capacity denominator is nameplate, as reported by the CPIA, and it includes older lines that may never restart. That inflates the idle share somewhat. It does not reverse it. A home market forecast at 180 GW to 240 GW for 2026 sits against 1,100 GW of module lines, and the export data shows no channel large enough to close that gap.
How Much Solar Is China Installing in 2026?
The domestic market is contracting for the first time since 2019. The National Energy Administration reports 86.15 GW of new solar power capacity from January to July 2026. NEA’s photovoltaic-only figure for the same period, carried by China News Service, is 85.65 GW. The 0.5 GW gap is the difference between the “solar power” category, which includes solar thermal, and photovoltaics alone.
That total is 61.4% below the 223.25 GW installed in the first seven months of 2025, a comparison distorted by the rush to connect projects before market-based pricing took effect on June 1, 2025. July alone added 14.08 GW.
China solar installations, 2025 vs 2026
| Period | New capacity | Source |
|---|---|---|
| Full year 2025 | 315.07 GW AC | NEA via TaiyangNews |
| Full year 2025 (alternate) | 317 GW AC | IEA PVPS |
| Q1 2026 | 41.39 GW AC | NEA via TaiyangNews |
| H1 2026 | 72.07 GW AC | CPIA |
| Jan to Jul 2026 (solar, incl. thermal) | 86.15 GW | NEA |
| Jan to Jul 2026 (PV only) | 85.65 GW | NEA via China News Service |
| 2026 full-year forecast | 180 to 240 GW AC | CPIA |
The two 2025 totals (315.07 GW and 317 GW) come from different compilers and are published side by side, not reconciled.
In 2025, IEA PVPS breaks the market into 164 GW of utility-scale plants, 107 GW of commercial and industrial systems and 46 GW of residential rooftops.
Solar overtakes coal in China’s power capacity
According to the NEA, China’s photovoltaic capacity reached 1,286 GW at the end of July 2026, of which 704 GW is centralized and 582 GW distributed, passing coal power’s 1,285 GW for the first time. Photovoltaics generated 802.4 TWh in the first seven months of 2026, 13% of national power consumption. Total generation capacity stood at 4,080 GW, with solar capacity up 16.1% year on year, per the NEA’s January to July statistics.
For the global deployment picture, see our solar energy statistics.
The home-market coverage ratio
Axis Intelligence Research divides module output by domestic installations to show how much of China’s production its own grid can absorb. In 2025 the ratio was 1.97; in the first half of 2026 it widened to 2.79. Because installations are reported in AC and module output in DC, the ratio is directional, but the jump is the point: China now makes close to three watts of modules for every watt it connects at home.
How Much Solar Does China Export?
Exports became the pressure valve. According to the CPIA, China exported $17.18 billion of wafers, cells and modules in the first half of 2026, up 24.3%. Cell exports rose 36.8%, while module export volumes fell 2.5%.
The March 2026 export spike
According to Ember’s analysis of Chinese customs data, China exported a record 68 GW of solar products in March 2026, 49% above the previous record set in August 2025. Two forces stacked: an energy price shock tied to the war with Iran and buyers front-running the end of export VAT rebates on April 1, which Ember estimates adds 9% to panel costs.
| March 2026 export breakdown | Volume | Source |
|---|---|---|
| Total wafers, cells and modules | 68 GW | Ember |
| Modules | 32 GW | Ember |
| Cells and wafers | 36 GW | Ember |
| To Asia | 39 GW | Ember |
| To Africa | 10 GW | Ember |
| Countries setting all-time import records | 50 | Ember |
Axis Intelligence Research calculates that cells and wafers made up 52.9% of the March total. Ember notes cell and wafer exports overtook panel exports in October 2025, as more assembly moves to India, Southeast Asia, the Middle East and Africa.
Where the exports go
The market map is widening. The CPIA’s five-year review states that the top 10 destinations fell from 72.6% of export value in 2021 to below 50% in 2025, and Europe’s share dropped to 39.2%. Across the whole 14th Five-Year Plan period, cumulative PV export value reached $189.5 billion.
The export rebate removal
The Ministry of Finance and State Taxation Administration cancelled VAT export rebates on photovoltaic products from April 1, 2026, and cut the battery rebate from 9% to 6%, before eliminating it on January 1, 2027, according to the State Council Information Office. The CPIA backed the move as a way to stop export prices falling too fast. Battery exporters face the same squeeze on a delay, a thread we follow in our China EV statistics.
Mia Scarlett’s read: Separate the one-off from the trend, the way you would strip a settlement out of a quarter. March’s 68 GW includes demand pulled forward by the rebate deadline, so it is a peak, not a run rate. Underneath it, module export volumes fell 2.5% in the first half while export value rose 24.3%. The growth is in cells and wafers: overseas buyers still want Chinese inputs, and increasingly keep the assembly margin for themselves.
What Do Chinese Solar Modules Cost in 2026?
Prices bottomed and are twitching upward on cost and tariff news rather than demand. According to OPIS, the Chinese Module Marker for TOPCon modules below 645 W rose to $0.108/W FOB China in its August 25, 2026 assessment, as reported by pv magazine USA. Forward prices for Q1 2027 loading stood at $0.107/W. TOPCon M10 cell prices reached $0.0532/W, about 34% above early August levels.
Earlier in the year, the CPIA reported that by early July polysilicon prices were 42.3% below January, wafers 28.7% lower and cells 27.7% lower, while module prices were around 3% higher, partly because of the rebate change.
The US Section 232 price floor
The US Section 232 measures, effective December 4, 2026, set minimum import prices of $0.38/W for modules, $0.22/W for cells and $100/kg for ingots and wafers, according to the same OPIS report. Axis Intelligence Research calculates the module floor at 3.52 times the current Chinese FOB benchmark.
| Price benchmark | Value | As of | Source |
|---|---|---|---|
| OPIS CMM, TOPCon module FOB China | $0.108/W | Aug 25, 2026 | OPIS via pv magazine USA |
| TOPCon module forward, Q1 2027 loading | $0.107/W | Aug 25, 2026 | OPIS |
| TOPCon M10 cell FOB China | $0.0532/W | Aug 25, 2026 | OPIS |
| US Section 232 module minimum import price | $0.38/W | Effective Dec 4, 2026 | OPIS |
| Polysilicon price change, Jan to early Jul | -42.3% | Early Jul 2026 | CPIA |
Which Chinese Solar Companies Are Losing the Most Money?
All five of the largest listed manufacturers reported first-half 2026 losses attributable to shareholders. Axis Intelligence Research sums the headline losses at CNY 14.814 billion, roughly $2.20 billion.
China solar company results, H1 2026
| Company | Revenue (CNY bn) | Net income (CNY bn) | Module shipments | Source |
|---|---|---|---|---|
| LONGi | 27.045 | -3.684 | 29.93 GW | LONGi report via EnergyTrend |
| JinkoSolar | 24.73 | -3.08 | 29.64 GW | Company report via pv magazine |
| Trina Solar | 31.99 | -0.27 (adjusted -2.89) | over 25 GW | Company report via pv magazine |
| JA | 17.50 | -2.66 | 22.25 GW (cells and modules) | Company report via pv magazine |
| Tongwei | 34.36 | -5.12 | 13.07 GW (plus 155,300 t polysilicon) | Company report via pv magazine |
Trina’s small headline loss leans on investment and fair-value gains; its adjusted loss was CNY 2.89 billion. LONGi sold 19.55 GW of back-contact modules, its fastest-growing line. JinkoSolar cut its 2026 shipment guidance to 60 GW to 70 GW.
Loss per watt shipped
Axis Intelligence Research divides each module maker’s H1 2026 loss by its shipments to estimate what every watt sold cost the company. The result is strikingly uniform.
| Company | Loss per watt shipped (est.) | As share of OPIS CMM price (est.) |
|---|---|---|
| LONGi | CNY 0.123 | 17.0% |
| JA | CNY 0.120 | 16.5% |
| Trina Solar (adjusted) | CNY 0.116 | 15.9% |
| JinkoSolar | CNY 0.104 | 14.3% |
Formula: net loss ÷ module shipments; share = loss per watt ÷ (0.108 × 6.72), where 6.72 is the CNY/USD rate implied by pv magazine’s own conversions (CNY 0.726/W). Group losses include non-module segments. Tongwei is excluded because its loss is driven by polysilicon and cells.
According to Axis Intelligence Research, the four integrated module leaders each lost between 14.3% and 17.0% of the benchmark module price on every watt they shipped. A price that sits that far under cost across four independent balance sheets is not a pricing mistake by one company; it is the market price of 480 GW of idle module lines.
Mia Scarlett’s read: Read the attributable line, then the adjusted one. Trina’s headline loss of CNY 0.27 billion looks like a turnaround until the CNY 2.89 billion adjusted figure appears. On a like-for-like basis, the spread between the best and worst module maker is under two fen per watt, which is what a commodity looks like in the filings. The segments that moved are the ones that are different: back-contact at LONGi, storage at Trina. For the data center buyers signing solar PPAs, covered in our big tech clean energy analysis, sub-cost modules are a subsidy nobody should model as permanent.
What Happens Next for China’s Solar Industry?
Three signals will decide whether the CSOI falls in 2027. First, whether capacity actually exits: the CPIA’s 5.8% decline in module capacity during 2025 is a start, and polysilicon consolidation is the stage to watch. Second, whether installations recover toward the CPIA’s forecast of 864 GW of global additions by 2030. Third, whether the Section 232 floor and local-content rules push more cell and wafer exports rather than modules, a shift the March data already shows. Power demand from AI facilities, tracked in our AI data center energy consumption statistics, is one demand lever the CPIA does not yet model explicitly.
FAQs: China Solar Industry Statistics
Why are Chinese solar manufacturers losing money while selling record volumes abroad?
Because export volume rose while prices stayed below cost. According to Axis Intelligence Research, LONGi, JinkoSolar, JA and Trina Solar each lost CNY 0.104 to CNY 0.123 per watt shipped in the first half of 2026, while the OPIS module benchmark sat near $0.108/W.
Is China’s solar overcapacity getting better or worse in 2026?
Worse on current data. The China Solar Overcapacity Index (CSOI) from Axis Intelligence Research rose from 53.5 in 2025 to an estimated 64.1 in the first half of 2026, because module output fell 35.1% while end-2025 capacity stayed largely in place.
How much of the world’s solar panels does China make?
China produced 574.5 GW of the 693.6 GW of solar modules made worldwide in 2025, according to the CPIA, an 82.8% share calculated by Axis Intelligence Research. The CPIA states China holds over 80% of capacity in every supply chain segment.
Did removing China’s export tax rebate raise solar panel prices?
It raised costs, and demand ran ahead of it. Ember estimates the April 1, 2026 removal adds 9% to panel costs, and exports hit a record 68 GW in March. The CPIA reported module prices around 3% higher by early July.
Has solar overtaken coal in China?
In installed capacity, yes. The NEA reported 1,286 GW of photovoltaic capacity at the end of July 2026 against 1,285 GW of coal power. In generation, coal still leads: photovoltaics supplied 13% of power consumption from January to July 2026.
How much solar will China install in 2026?
The CPIA forecasts 180 GW to 240 GW AC, down from 315.07 GW in 2025, which would be China’s first annual decline since 2019. The NEA counted 86.15 GW of new solar capacity from January to July 2026.
Why does China export more solar cells and wafers than before?
Buyers are assembling modules closer to home to meet local-content rules and tariffs. Ember reports cell and wafer exports overtook panel exports in October 2025, and they made up 36 GW of the record 68 GW shipped in March 2026.
What will the US Section 232 minimum price mean for Chinese solar modules?
From December 4, 2026, the US sets a minimum import price of $0.38/W for modules, per OPIS. Axis Intelligence Research calculates that is 3.52 times the $0.108/W FOB China benchmark, effectively closing the US to low-priced Chinese-origin supply.
Methodology
Collection. Every figure on this page was retrieved and verified during production for this September 17, 2026 edition, with the source URL and retrieval date logged in the CSV. Production, capacity, export value and price-change data come from the China Photovoltaic Industry Association, accessed through the IEA PVPS China country update and through trade press reports of CPIA conferences. Installation and power-mix data come from the National Energy Administration. Monthly export volumes come from Ember’s analysis of General Administration of Customs data. Policy dates come from the State Council Information Office. Price benchmarks come from OPIS. Company results come from first-half 2026 reports as summarized by pv magazine and EnergyTrend.
Axis calculations. The CSOI is the equal-weighted mean of four stage idle shares, each equal to 1 minus output divided by capacity. The first-half 2026 reading doubles H1 output and holds end-2025 capacity constant, so it is labeled an estimate. Loss per watt divides headline attributable net loss (adjusted loss for Trina Solar) by module shipments. Currency conversion uses the 6.72 CNY/USD rate implied by pv magazine’s own figures. The home-market coverage ratio divides DC module output by AC installations and is directional.
Scope. Two calculations were declined and are logged as retracted rows in the CSV: a loss per watt for Tongwei (its losses are driven by polysilicon and cells, so a module denominator misleads) and a conversion of polysilicon inventory into module gigawatts (no verified grams-per-watt factor was fetched). Where two sources disagree (2025 module output, 2025 installations, January to July installations) both values are published and labeled. Capacity figures are nameplate, as reported by the CPIA.
About This Dataset
china-solar-industry-statistics-2026.csv contains 146 rows covering China’s solar production, capacity, CSOI components, installations, exports, prices and company results from 2020 to September 2026. Every row carries the issuing organization, source document, URL, retrieval date, a primary-source flag, an Axis-calculated flag and, for calculated rows, the formula.
License. CC BY 4.0. Free to use, including commercially, with attribution.
Citation format. Axis Intelligence Research, China Solar Industry Statistics 2026, 2026.
Cite This Page
APA: Axis Intelligence Research. (2026). China solar industry statistics 2026: Production, overcapacity, exports and market share. Axis Intelligence. https://axis-intelligence.com/china-solar-industry-statistics/
MLA: Axis Intelligence Research. “China Solar Industry Statistics 2026: Production, Overcapacity, Exports and Market Share.” Axis Intelligence, 17 Sept. 2026, axis-intelligence.com/china-solar-industry-statistics/.
Chicago: Axis Intelligence Research. “China Solar Industry Statistics 2026: Production, Overcapacity, Exports and Market Share.” Axis Intelligence, September 17, 2026. https://axis-intelligence.com/china-solar-industry-statistics/.