


Millennial Statistics 2027: Age Range, Wealth, Homes, Debt, Work and Spending Habits
Millennial Statistics 2027 By Axis Intelligence Research Co-author: David Park | Last updated: November 7, 2026 | License: CC BY 4.0 Millennials, born 1981 to 1996, turn 31 to 46 in 2027. Th

Gen Z Statistics 2027: How Many, How They Live, and How Different They Really Are
Gen Z Statistics 2027 By Axis Intelligence Research Co-author: David Park | Last updated: November 7, 2026 | License: CC BY 4.0 Gen Z (born 1997 to 2012) numbers 72.2 million Americans and a

Tech Layoffs 2026: 165,925 Job Cuts Through September, 2,470 Short of the All-Time Record — and What 2027 Looks Like
Tech Layoffs Statistics 2026 By Axis Intelligence Research Co-author: David Park | Last updated: October 29, 2026 | License: CC BY 4.0 U.S. technology companies announced 165,925 job cuts fr

AI Job Displacement Statistics 2026: Under 1% of U.S. Layoffs Cite AI, and the Entry Rung Is Where It Shows
AI Job Displacement Statistics 2026 By Axis Intelligence Research Co-author: David Park | Last updated: October 29, 2026 | License: CC BY 4.0 U.S. employers attributed 120,136 announced job

Layoff Statistics 2026: 13.8 Million U.S. Layoffs, and Why Only 1 in 26 Is Ever Announced
Layoff Statistics 2026 By Axis Intelligence Research Co-author: David Park | Last updated: October 26, 2026 | License: CC BY 4.0 U.S. employers laid off or discharged 13.8 million workers be

Business Intelligence Statistics 2026: Who Actually Uses BI, What It Costs, and the Vendors Reshaping the Market
Business Intelligence Statistics 2026 By Axis Intelligence Research Co-author: Elena Rodriguez | Last updated: October 25, 2026 | License: CC BY 4.0 Only 16.28% of EU enterprises used busine

Freelance Statistics 2026: More Freelancers, Fewer Buyers, and What the Platforms Keep
Freelance Statistics 2026 By Axis Intelligence Research Co-author: Mia Scarlett & David Park | Last updated: October 21, 2026 | License: CC BY 4.0 Fiverr closed June 2026 with 2.676 mill

H-1B Salary by Company 2026: What 40 Top Sponsors Pay, Who Pays Only the Legal Minimum, and Who Wins the Wage-Weighted Lottery
H1B Salary by Company 2026 By Axis Intelligence Research Co-author: David Park | Last updated: October 18, 2026 | License: CC BY 4.0 Across 384,130 certified full-time H-1B Labor Condition A

H-1B Visa Statistics 2026: Lottery Odds, Registrations, Fees and the H-1B Entry Barrier Index
H1B Visa Statistics 2026 By Axis Intelligence Research Co-author: David Park | Last updated: October 18, 2026 | License: CC BY 4.0 Employers filed 211,600 H-1B cap registrations for fiscal 2

Job Scam Statistics 2026: Losses Up 5.2x in Two Years, and 79% Now Move Through Crypto
Job Scam Statistics 2026 By Axis Intelligence Research Co-authors: David Park & Marcus Chen | Last updated: October 15, 2026 | License: CC BY 4.0 Americans reported losing $362,934,762 t

Personal Loan Statistics 2026: $281 Billion Owed, 11.90% Rates and the Card-to-Loan Spread
Personal Loan Statistics 2026 By Axis Intelligence Research Co-author: Sarah Davis | Last updated: October 13, 2026 | License: CC BY 4.0 Americans owed a record $281 billion on unsecured per

Tax Refund Statistics 2026: The Average Refund Hit a Record $3,276, and Still Buys Less Than It Did in 2010
Average Tax Refund 2026 By Axis Intelligence Research Co-author: Sarah Davis | Last updated: October 13, 2026 | License: CC BY 4.0 The average federal tax refund reached $3,276 by May 8, 202

Social Security COLA Statistics 2026: The 3.6% COLA for 2027, Every COLA Since 1975, and What the Inflation Lag Costs Retirees
2027 Social Security COLA By Axis Intelligence Research Co-author: David Park | Last updated: October 14, 2026 | License: CC BY 4.0 The 2027 Social Security COLA is 3.6%, the Social Security

Social Security by State 2026: Average Checks, Recipients, and the States That Depend on It Most
Social Security by State 2026 By Axis Intelligence Research Co-author: David Park | Last updated: October 12, 2026 | License: CC BY 4.0 Social Security paid 68,809,764 beneficiaries across t

Social Security Statistics 2026: 71.5 Million Beneficiaries, a Late-2032 Cliff for Retirees, and How Much of Each COLA Medicare Takes Back
Social Security Statistics 2026 By Axis Intelligence Research Co-author: David Park | Last updated: October 11, 2026 | License: CC BY 4.0 Social Security paid 71.5 million beneficiaries in A
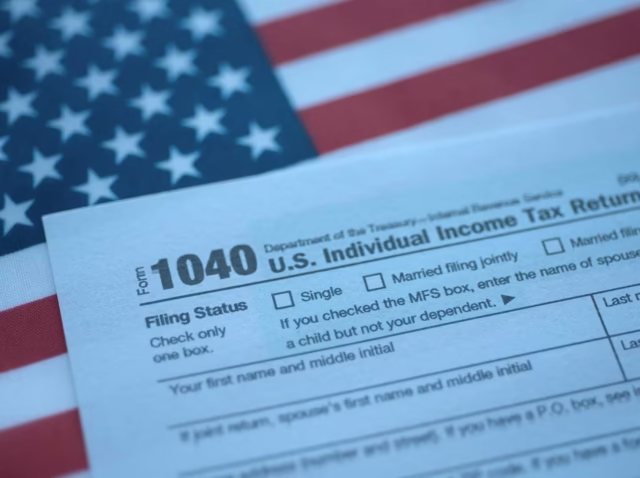
US Tax Statistics 2026: Where $5.4 Trillion Comes From, Who Pays It, and the Tariff Refund Reversal
US Tax Statistics 2026 By Axis Intelligence Research Co-author: Mia Scarlett | Last updated: October 11, 2026 | License: CC BY 4.0 The US federal government collected $5,403 billion in fisca

Hybrid Work Statistics 2026: 18.8 Million Americans, a Tuesday-Shaped Office Week, and Europe’s Hybrid Map
Hybrid Work Statistics 2026 By Axis Intelligence Research Co-author: David Park | Last updated: October 10, 2026 | License: CC BY 4.0 18.8 million Americans worked hybrid in 2025 — 11.9% o
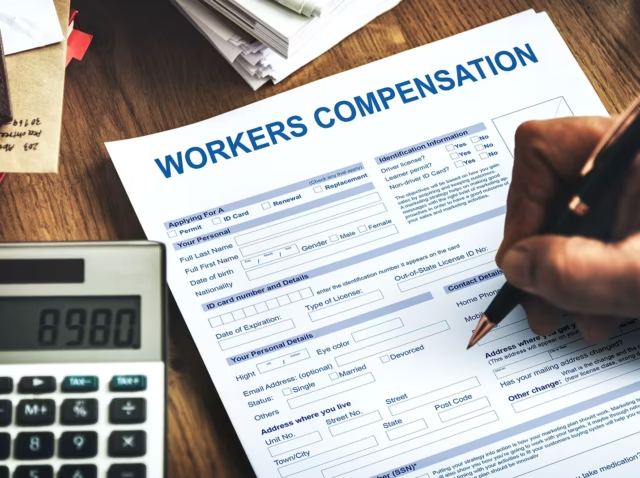
Workers’ Compensation Statistics 2026: Injuries, Premiums, Claim Costs and the Price of Risk by State
Workers’ Compensation Statistics 2026 By Axis Intelligence Research Co-authors: Mia Scarlett & David Park | Last updated: October 10, 2026 | License: CC BY 4.0 U.S. workers’

Student Loan Debt Statistics 2026: 9.3 Million Borrowers in Default and the Distress Ratio Nobody Else Tracks
Student Loan Debt Statistics 2026 By Axis Intelligence Research Co-author: David Park | Last updated: October 6, 2026 | License: CC BY 4.0 Americans owe $1,858.2 billion in student loans as

401(k) Statistics 2026: $10.8 Trillion, Record Savings Rates, and the Loan Problem Underneath
401(k) Statistics 2026 By Axis Intelligence Research Co-author: David Park | Last updated: October 5, 2026 | License: CC BY 4.0 Americans held $10.8 trillion in 401(k) plans as of June 30, 2

US Net Worth Percentiles 2026: What It Takes to Reach the Top 50%, 10% and 1% of US Households
US Net Worth Percentiles 2026 By Axis Intelligence Research Co-author: David Park | Last updated: October 4, 2026 | License: CC BY 4.0 According to Axis Intelligence Research, a US household

US Retirement Savings Statistics 2026: $51.2 Trillion Saved, 60 Million Private Workers Outside the Plan
US Retirement Savings Statistics 2026 By Axis Intelligence Research Co-author: David Park | Last updated: October 4, 2026 | License: CC BY 4.0 Americans held a record $51.2 trillion in retir

US Health Insurance Cost 2026: What a Single Adult and a Family Really Pay, Employer Plan vs Marketplace
Health Insurance Cost 2026 By Axis Intelligence Research Co-author: David Park | Last updated: October 3, 2026 | License: CC BY 4.0 Prices verified on October 3, 2026. Every premium, deducti

Tax Preparation Services Cost 2026: What a CPA, Enrolled Agent, H&R Block and TurboTax Really Charge
Tax Preparation Services Cost 2026 By Axis Intelligence Research Co-author: David Park | Last updated: October 3, 2026 | License: CC BY 4.0 Prices verified on October 3, 2026. Every vendor p

Data Analytics Statistics 2026: Adoption, Jobs, Spend and the Conversion Gap
Data Analytics Statistics 2026 By Axis Intelligence Research Co-author: Elena Rodriguez | Last updated: September 30, 2026 | License: CC BY 4.0 Only 39.85% of EU enterprises ran any data ana

Side Hustle Statistics 2026: 8.5 Million Americans Hold a Second Job — and Women Now Hold Most of Them
Side Hustle Statistics 2026 By Axis Intelligence Research Co-author: David Park (Careers & Workforce) | Last updated: September 30, 2026 | License: CC BY 4.0 8.5 million Americans held t

Women in Tech Statistics 2026: Representation, Pay and the Technology Parity Gap Index
Women in Tech Statistics 2026 By Axis Intelligence Research Co-author: David Park, Careers & Compensation | Last updated: September 22, 2026 | License: CC BY 4.0 Women hold 27.5% of the

AI Job Market Statistics 2026: U.S. Postings, Salaries, Skills and Where Demand Is Really Growing
AI Job Market Statistics 2026 By Axis Intelligence Research Co-author: David Park, Careers and Workforce | Last updated: September 1, 2026 | License: CC BY 4.0 The share of U.S. job postings

AI Job Losses by Industry 2026: Statistics, Sector Rankings & Displacement Data
AI Job Losses by Industry 2026 By Axis Intelligence Research Co-author: David Park | Last updated: August 19, 2026 | License: CC BY 4.0 American employers attributed 112,713 announced job cu

Recruitment Statistics 2026: Hiring Yield, Job Vacancies and the Recruitment Friction Index
Recruitment Statistics 2026 By Axis Intelligence Research Co-author: David Park | Last updated: August 19, 2026 | License: CC BY 4.0 American employers held 7.4 million open jobs in June 202

Gen Z Workplace Statistics 2026: Tenure, Engagement, and the Job-Hopping Myth
Gen Z Workplace Statistics 2026 By Axis Intelligence Research Co-author: David Park | Last updated: August 18, 2026 | License: CC BY 4.0 Median job tenure for American workers aged 20 to 24

Gen Z Employment Statistics 2026: Unemployment, Wages, and the Entry-Level Penalty
Gen Z Employment Statistics 2026 By Axis Intelligence Research Co-author: David Park | Last updated: August 18, 2026 | License: CC BY 4.0 In July 2026, unemployment among Americans aged 20 t

US Return to Office Statistics 2026: Telework Rates by Industry, State, and Occupation
Return to Office Statistics 2026 By Axis Intelligence Research Co-author: David Park | Last updated: August 17, 2026 | License: CC BY 4.0 The U.S. telework rate was 22.2% in July 2026 — 34

HR Statistics 2026: Hiring, Turnover, Compensation and Benefits Data
HR Statistics 2026 By Axis Intelligence Research Co-author: David Park | Last updated: August 16, 2026 | License: CC BY 4.0 U.S. employers held 7.4 million open jobs in June 2026 while hirin

AI in HR Statistics 2026: Adoption, Governance Gaps, and the Enforcement Data
AI in HR Statistics 2026 By Axis Intelligence Research Co-authors: Sarah Mitchell (AI & Machine Learning) and David Park (Careers & Workforce) | Last updated: August 9, 2026 | Licens

US Employee Turnover Statistics 2026: Quit Rates, Layoffs, Tenure, and Who Controls the Exit
US Employee Turnover Statistics 2026 By Axis Intelligence Research Co-author: David Park (Careers & Workforce) | Last updated: August 8, 2026 | License: CC BY 4.0 American workers quit 3

Financial Literacy Statistics 2026: The Decade-Low Reckoning
Financial Literacy Statistics 2026 By Axis Intelligence Research Co-author: David Park | Last updated: July 31, 2026 | License: CC BY 4.0 Quick Answer According to the 2026 TIAA Institute–

Digital Nomad Statistics 2026: 18.5 Million Americans Now Work Remotely While Traveling — and the AI Surge Is Reshaping Who They Are
Digital Nomad Statistics 2026 By Axis Intelligence Research Co-author: David Park | Last updated: July 17, 2026 | License: CC BY 4.0 18.5 million American workers identified as digital nomad

AI Replacing Jobs Statistics 2026: Confirmed Cuts, Sector Data & Displacement Projections
AI Replacing Jobs Statistics 2026 By Axis Intelligence Research Co-author: David Park | Last updated: June 23, 2026 | Next scheduled update: Q3 2026 (after Q2 earnings, expected July 22, 202

Gig Economy Statistics 2026: How Many Gig Workers There Actually Are
Gig Economy Statistics 2026 By Axis Intelligence Research Co-author: David Park, Careers, Work & Education | Last updated: August 5, 2026 | License: CC BY 4.0 The U.S. government has ask

AI Job Loss Statistics 2026: Automation, Unemployment, and the Real Data Behind the Headlines
AI Job Loss Statistics 2026 Between 2 million and 300 million jobs are “at risk” from AI, depending on which report you read. That 150-fold gap is the actual problem — not the