


Tesla Statistics 2026–2027: Deliveries, Revenue, FSD, Robotaxi and the 2027 Milestones
Tesla Statistics 2026–2027 By Axis Intelligence Research Co-author: Aidan Jad | Last updated: November 6, 2026 | License: CC BY 4.0 Tesla delivered 1,324,681 vehicles in January–Septembe

BYD Statistics 2026–2027: Sales, Revenue, Exports & What Q3 2026 Changes
BYD Statistics 2026 By Axis Intelligence Research Co-author: Aidan Jad, EV & Energy Correspondent | Last updated: November 6, 2026 | License: CC BY 4.0 BYD sold 4,602,436 new energy vehi
Electric Vehicle Statistics 2026: Global Sales, Battery Costs & Charging Data
Electric Vehicle Statistics 2026 By Axis Intelligence Research Co-author: Aidan Jad | Last updated: October 29, 2026 | License: CC BY 4. Global electric vehicle sales reached 15.5 million in

Tesla Solar Roof Cost 2026: The Final Price per Square Foot, Why Tesla Killed It, and What Replaces It
Tesla Solar Roof Cost 2026 By Axis Intelligence Research Co-author: Aidan Jad | Last updated: October 9, 2026 | License: CC BY 4.0 Tesla’s last documented Solar Roof quotes ran $20.25

EV vs Gas Car Total Cost of Ownership 2026: The Gas Price Where Each EV Wins
EV vs Gas Car Cost of Ownership 2026 By Axis Intelligence Research Co-author: Aidan Jad | Last updated: October 8, 2026 | License: CC BY 4.0 At $4.354 a gallon, an electric medium SUV now co
Tesla Cost of Ownership 2026: What Every Model 3 and Model Y Really Costs Over 5 Years, Priced From Tesla’s Own Used Inventory
Tesla Cost of Ownership 2026 By Axis Intelligence Research Co-author: Aidan Jad | Last updated: October 8, 2026 | License: CC BY 4.0 A new Tesla costs $35,437 to $45,259 to own for five year
Cost to Charge an EV at Home vs Public Fast Chargers (2026): Fast Charging Now Costs About the Same as Gas
EV Charging Cost 2026 By Axis Intelligence Research Co-author: Aidan Jad | Last updated: October 8, 2026 | License: CC BY 4.0 Charging an EV at home costs about $49 per 1,000 miles in 2026.
EV Insurance Cost 2026: 56 Electric Models Ranked by Claims Data, and Why the Gap Is Closing
EV Insurance Cost 2026 By Axis Intelligence Research Co-author: Aidan Jad | Last updated: October 8, 2026 | License: CC BY 4.0 The median electric vehicle costs an estimated $1,899.67 a year

EV Charger Installation Cost 2026: What a Level 2 Home Charger Really Costs Once the Panel Gets Involved
EV Charger Installation Cost 2026 By Axis Intelligence Research Co-author: Aidan Jad | Last updated: October 7, 2026 | License: CC BY 4.0 A Level 2 EV charger installed on a new dedicated ci
US EV Sales by Automaker 2026: Parent-Company Volumes, Market Share and the Post-Credit Retention Rate
US EV Sales by Automaker 2026 By Axis Intelligence Research Co-author: Aidan Jad, EV & Clean Energy | Last updated: September 21, 2026 | License: CC BY 4.0 American-badged automakers sol

Mercedes-Benz EV Sales Statistics 2026: BEV Volume, Model Mix, Revenue and Market Share
Mercedes-Benz EV Sales Statistics 2026 By Axis Intelligence Research Co-author: Aidan Jad, EV & Clean Energy | Last updated: September 21, 2026 | License: CC BY 4.0 Mercedes-Benz Cars so

BMW EV Sales Statistics 2026: Deliveries, Market Share, Revenue and the Europe Concentration Shift
BMW EV Sales Statistics 2026 By Axis Intelligence Research Co-author: Aidan Jad, EV & Clean Energy | Last updated: September 21, 2026 | License: CC BY 4.0 BMW Group delivered 116,807 bat

Volkswagen EV Sales Statistics 2026: BEV Deliveries, Market Share, Models and Investment
Volkswagen EV Sales Statistics 2026 By Axis Intelligence Research Co-author: Aidan Jad, EV & Clean Energy | Last updated: September 20, 2026 | License: CC BY 4.0 Volkswagen Group deliver

Li Auto Deliveries, Revenue and Margins 2026: The Cost of the EREV-to-BEV Transition
Li Auto Deliveries & Margins 2026 By Axis Intelligence Research Co-author: Aidan Jad, EV & Clean Energy | Last updated: September 20, 2026 | License: CC BY 4.0 Li Auto delivered 98,3

Xiaomi EV Sales Statistics 2026: Deliveries, ASP, Margins and the 550,000 Target Gap
Xiaomi EV Sales Statistics 2026 By Axis Intelligence Research Co-author: Aidan Jad, EV & Clean Energy | Last updated: September 20, 2026 | License: CC BY 4.0 Xiaomi delivered 246,475 veh

XPeng Deliveries, Revenue and Margin Statistics 2026: The Full Data Set
XPeng Deliveries & Revenue Statistics 2026 By Axis Intelligence Research Co-author: Aidan Jad, EV & Clean Energy | Last updated: September 20, 2026 | License: CC BY 4.0 XPeng reporte

Geely Sales Statistics 2026: Exports, NEV Mix, Zeekr, Galaxy, Revenue & Margins
Geely Sales Statistics 2026 By Axis Intelligence Research Co-author: Aidan Jad, EV & Clean Energy | Last updated: September 20, 2026 | License: CC BY 4.0 Geely Automobile Holdings sold 1

Used EV Statistics 2026: Sales, Prices, Market Share and Resale Values
Used EV Statistics 2026 By Axis Intelligence Research Co-author: Aidan Jad, EV & Energy Infrastructure | Last updated: September 18, 2026 | License: CC BY 4.0 American buyers took home 4
US EV Statistics 2026: Plug-In Sales Fell 28% and Hybrids Absorbed Almost All of It
US EV Statistics 2026 By Axis Intelligence Research Co-authors: Aidan Jad (EV & Energy) | Last updated: September 11, 2026 | License: CC BY 4.0 Americans bought 660,373 plug-in vehicles
EV Sales by Brand 2026: BYD vs Tesla, Top Automakers and Best-Selling Electric Models
EV Sales by Brand 2026 By Axis Intelligence Research Co-authors: Aidan Jad (EV & Energy) | Last updated: September 11, 2026 | License: CC BY 4.0 BYD sold 867,479 battery-electric cars in
EV Sales by Country 2026: China, Europe, the US and the Breakout Markets Nobody Is Ranking
EV Sales by Country 2026 By Axis Intelligence Research Co-authors: Aidan Jad (Energy & Infrastructure) | Last updated: September 11, 2026 | License: CC BY 4.0 More than 20 million electr

Europe EV Manufacturing Statistics 2026: Car Plants, Gigafactories, Jobs and the China Trade Flip
Europe EV Manufacturing Statistics 2026 By Axis Intelligence Research Co-author: Aidan Jad, EV & Clean Energy | Last updated: September 10, 2026 | License: CC BY 4.0 The European Union b

European Automaker Statistics 2026: Revenue, Margins and Profit Per Car at VW, Stellantis, Renault, BMW and Mercedes
European Automaker Statistics 2026 By Axis Intelligence Research Co-author: Aidan Jad, EV & Clean Energy | Last updated: September 10, 2026 | License: CC BY 4.0 Europe’s five large
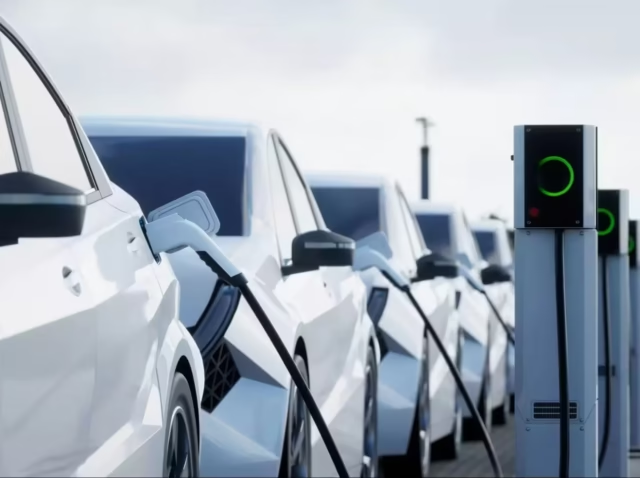
Europe EV Prices 2026: Average Cost, the Petrol Price Gap and the Affordability Divide
Europe EV Prices 2026 By Axis Intelligence Research Co-author: Aidan Jad, EV & Clean Energy | Last updated: September 9, 2026 | License: CC BY 4.0 The average new battery-electric car in
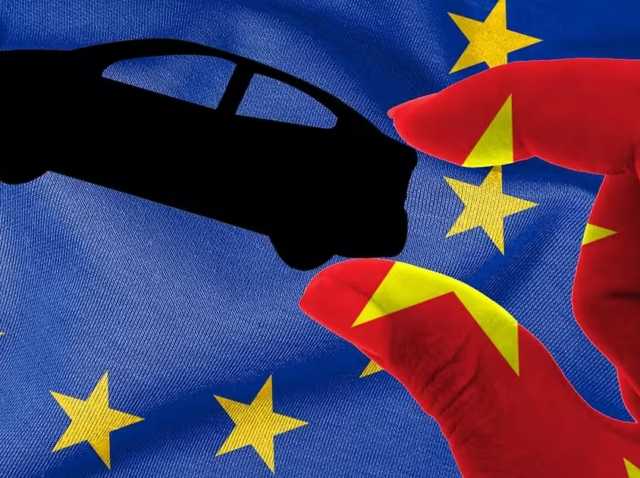
Chinese EV Market Share in Europe 2026: Brand Sales, Growth and the Tariff-Perimeter Gap
Chinese EV Market Share in Europe 2026 By Axis Intelligence Research Co-author: Aidan Jad, EV & Clean Energy | Last updated: September 9, 2026 | License: CC BY 4.0 Four Chinese import-le
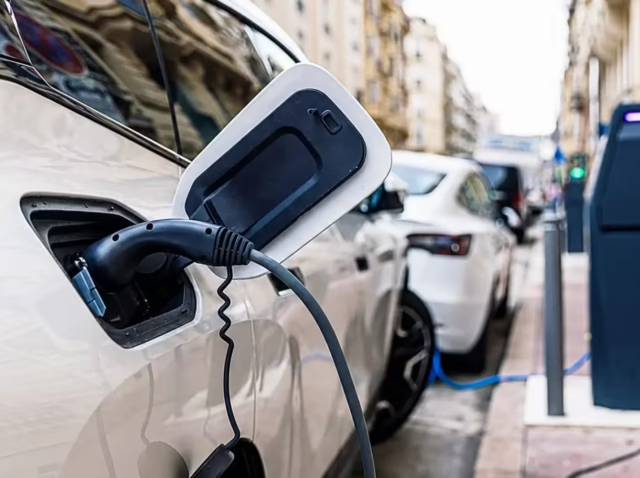
Europe EV Statistics 2026: BEV Market Share, Country Rankings and the Adoption Gap
Europe EV Statistics 2026 By Axis Intelligence Research Co-author: Aidan Jad, EV & Clean Energy | Last updated: September 9, 2026 | License: CC BY 4.0 Battery-electric cars took 20.7% of

Chinese EV Companies 2026: Sales, Profit Per Vehicle and Who Actually Makes Money
Chinese EV Companies 2026 By Axis Intelligence Research Co-author: Aidan Jad, EV & Clean Energy | Last updated: September 1, 2026 | License: CC BY 4.0 Six listed Chinese EV makers delive

China EV Export Statistics 2026: Sales, Market Share, Destinations & the Export Substitution Shift
China EV Export Statistics 2026 By Axis Intelligence Research Co-author: Aidan Jad, EV & Clean Energy | Last updated: September 1, 2026 | License: CC BY 4.0 China shipped 2,910,000 new e

China EV Statistics 2026: Fleet, Sales, Charging, Batteries & the 2030 Target
China EV Statistics 2026 By Axis Intelligence Research Co-author: Aidan Jad, EV & Clean Energy | Last updated: September 1, 2026 | License: CC BY 4.0 China had 48.97 million new energy v

Rivian Statistics 2026: Deliveries, Revenue, R2 Ramp and the Cost of Scale
Rivian Statistics 2026 By Axis Intelligence Research Co-author: Aidan Jad | Last updated: August 4, 2026 | License: CC BY 4.0 Rivian delivered 12,194 vehicles in the second quarter of 2026 a
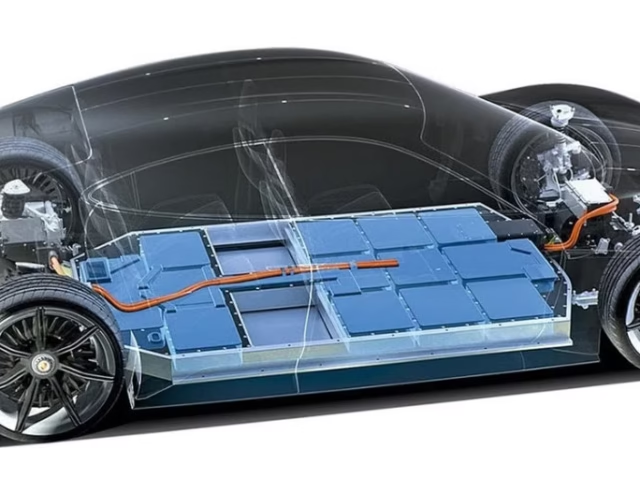
EV Battery Statistics 2026: Prices, Chemistry, Market Share & Recycling Data
EV Battery Statistics 2026 By Axis Intelligence Research Co-author: Aidan Jad | Last updated: July 24, 2026 | License: CC BY 4.0 Global EV battery deployment reached 1.2 TWh in 2025 — a 30
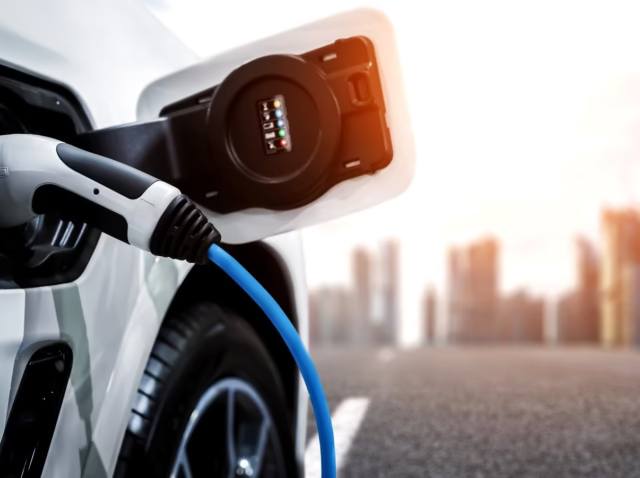
EV Charging Statistics 2026: Global Infrastructure, Costs & the Reliability Gap
EV Charging Statistics 2026 By Axis Intelligence Research Co-author: Aidan Jad | Last updated: July 19, 2026 | License: CC BY 4.0 Quick Answer The global public EV charging network crossed 7
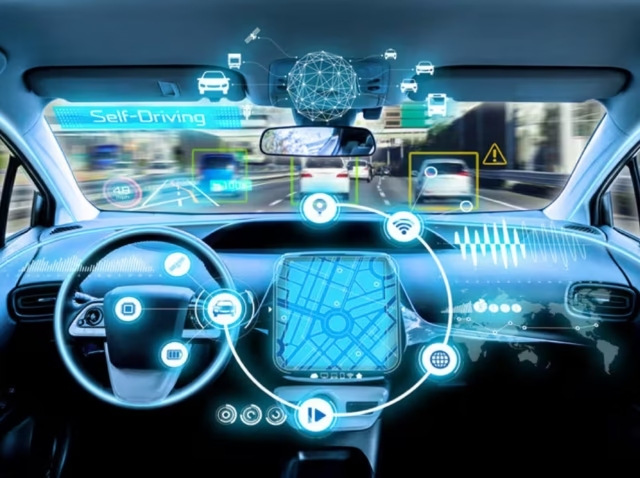
Connected Car Market 2026: 400 Million Vehicles, $9 Billion Data Economy, and a Ransomware Crisis
Connected Car Market 2026 By Axis Intelligence Research Co-author: Aidan Jad | Last updated: July 15, 2026 | License: CC BY 4.0 More than 400 million cars now stream data continuously from t
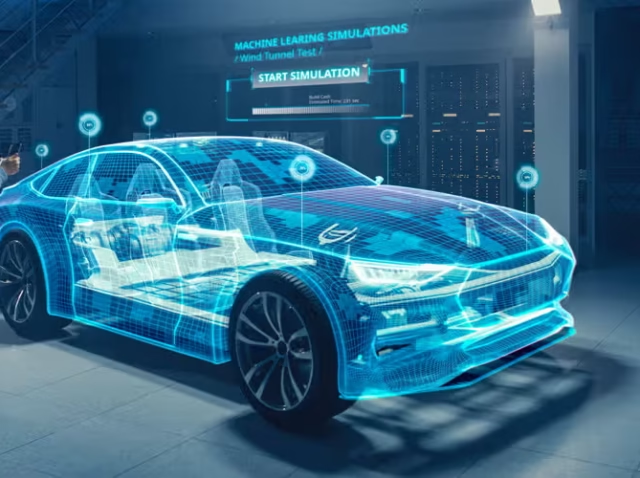
EV Adoption Statistics 2026: One in Four New Cars Is Now Electric — and the World Is Splitting
EV Adoption Statistics 2026 By Axis Intelligence Research Co-author: Aidan Jad | Last updated: June 22, 2026 | Next scheduled update: Q3 2026 | License: CC BY 4. Quick Answer: Global electri