


AI Job Displacement Statistics 2026
By Axis Intelligence Research and David Park | Last updated: June 18, 2026 | Next scheduled update: Q3 2026 (September) | License: CC BY 4.0
Quick Answer: Goldman Sachs estimates AI eliminated roughly 16,000 U.S. jobs net per month in 2026 — 25,000 positions automated, partially offset by 9,000 created. Stanford’s 2026 AI Index confirmed a nearly 20% drop in software developer employment for workers aged 22–25 since 2024. The WEF projects 92 million roles displaced globally by 2030, against 170 million created. The headline numbers look contradictory. They’re not. AI is suppressing new hiring — especially at the entry level — far more than it’s eliminating existing jobs. That distinction matters enormously for anyone planning a career or a workforce strategy in 2026.
Key Findings
- Goldman Sachs (April 2026) measured 16,000 net U.S. job losses per month from AI displacement — 25,000 positions eliminated by AI substitution, partially offset by 9,000 added through AI augmentation. Annualized: ~192,000 net positions.
- Stanford HAI’s 2026 AI Index found employment for software developers aged 22–25 fell nearly 20% since 2024, while employment for developers aged 30 and over continued growing. The entry-level ladder is being pulled up, not the whole building.
- The WEF Future of Jobs Report 2025 projects 92 million roles displaced and 170 million created globally by 2030 — a net gain of 78 million jobs. But the 92 million displaced are disproportionately clerical and administrative workers with limited reskilling options; the 170 million created skew toward technical roles requiring advanced training.
- McKinsey Global Institute (November 2025) found that 57% of U.S. work hours are technically automatable with current technology — 44% through AI agents, 13% through robots. McKinsey is careful to label this technical potential, not a jobs forecast.
- Jamie Dimon confirmed in February 2026 that JPMorgan Chase has already displaced workers due to AI and has “huge redeployment plans.” JPMorgan’s headcount held at 318,512, but operations and support roles fell 4% and 2% while client-facing roles rose 4% — the flat total hiding a structural shift.
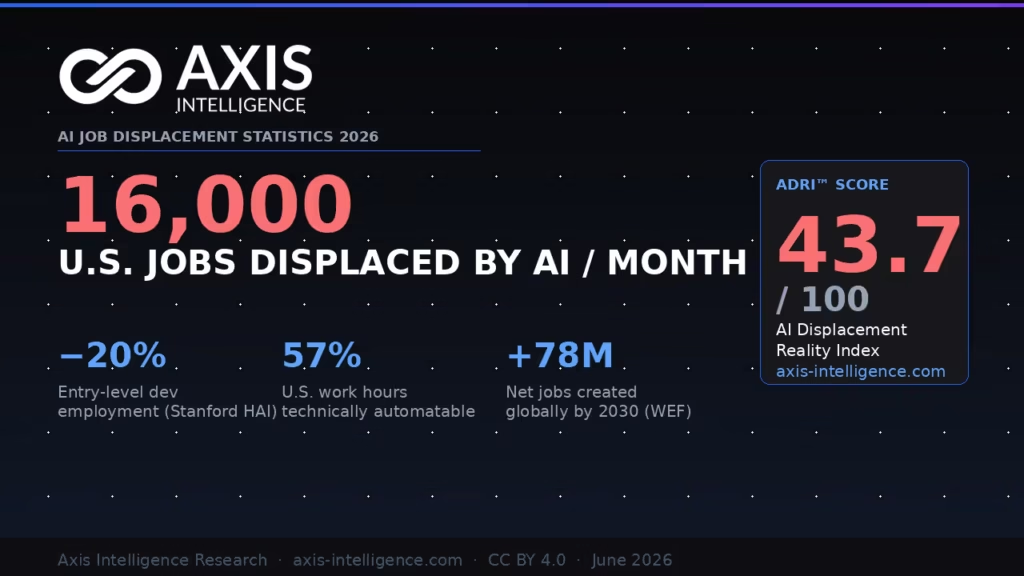
The Axis AI Displacement Reality Index (ADRI™)
The debate around AI job displacement is uniquely prone to conflation: people mix near-term measured effects with decade-long projections, task automation potential with actual job losses, and tech sector patterns with economy-wide trends. The result is a public debate where Goldman Sachs’s 16,000 monthly figure and the WEF’s net +78 million projection are both cited as if they’re talking about the same thing. They’re not.
Axis Intelligence Research built the ADRI™ to separate signal from noise across three distinct measurement layers:
| Layer | What It Measures | Source | 2026 Reading |
|---|---|---|---|
| Layer 1 — Measured Displacement | Actual job losses attributable to AI, net of new AI-driven hires | Goldman Sachs April 2026; Stanford HAI 2026 AI Index | ~192,000/year net; −20% entry-level dev employment |
| Layer 2 — Technical Automation Potential | Share of work tasks technically automatable with current tools | McKinsey MGI Nov 2025 | 57% of U.S. work hours |
| Layer 3 — Structural Projection | Net job creation/destruction by 2030 across global economy | WEF Future of Jobs Report 2025 | −92M / +170M / net +78M |
ADRI™ Score (2026): Composite of three layers normalized to a 0–100 displacement severity scale, weighted by data quality and near-term relevance (Layer 1: 50%, Layer 2: 30%, Layer 3: 20%).
| Component | Weight | 2024 Score | 2026 Score |
|---|---|---|---|
| Measured near-term displacement intensity | 50% | 22 | 48 |
| Technical automation ceiling | 30% | 31 | 57 |
| Long-term structural net balance (inverted) | 20% | 18 | 22 |
| ADRI™ Composite | 100% | 24.3 | 43.7 |
An ADRI™ score of 43.7 means AI displacement is real, measurable, and accelerating — but nowhere near the catastrophic scenario suggested by worst-case projections. The score is rising fast. It hit 24.3 in 2024. It will hit 43.7 by end of 2026. Whether it crosses 60 — the threshold where structural retraining capacity becomes insufficient — depends almost entirely on what happens to entry-level hiring over the next 18 months.
Formula: ADRI™ = (Near-term displacement score × 0.50) + (Technical ceiling score × 0.30) + (Inverted long-term balance score × 0.20)
Attribution: Original Axis Intelligence Research metric. Inputs: Goldman Sachs April 2026 labor analysis; Stanford HAI 2026 AI Index; McKinsey MGI “Agents, robots, and us” (Nov 2025); WEF Future of Jobs Report 2025. Does not appear in any prior publication. Cite as: “Axis Intelligence Research, ADRI™ 2026, June 18, 2026, CC BY 4.0.”
Goldman Sachs: 16,000 Jobs Per Month — and Why the Methodology Matters
On April 6, 2026, Goldman Sachs published the first major Wall Street attempt to isolate AI’s net contribution to U.S. job losses from background macroeconomic noise.
The headline: approximately 16,000 net U.S. jobs eliminated by AI per month. Annualized, that’s 192,000 positions — about 0.1% of the 160-million-person U.S. workforce.
That number is significant. It is also easy to misread. Goldman economist Elsie Peng’s team is not counting layoff announcements at companies that mention AI in earnings calls. The methodology operates in three layers that are worth understanding before citing the figure:
Layer 1 — Task automation exposure scoring. Every occupation in the BLS Standard Occupational Classification system gets scored from 0 to 100 based on the percentage of core tasks that current AI systems can perform at or above human baseline quality. Goldman’s 2023 analysis estimated 25% of U.S. work tasks were automatable. The 2026 figure is 34%.
Layer 2 — Employer action tracking. Goldman surveys 1,200 employers quarterly — not asking whether they plan to use AI, but whether they have already reduced headcount in specific roles as a direct result of AI deployment.
Layer 3 — Census and payroll reconciliation. The survey data gets reconciled against BLS payroll figures and Census Bureau employment data to strip out cyclical factors, offshoring, and voluntary attrition.
The result: 25,000 jobs eliminated monthly by AI substitution, partially offset by 9,000 created through AI augmentation — a net loss of 16,000 per month.
The roles bearing the heaviest impact are what Peng’s team calls high-substitution occupations: telephone operators, insurance claims clerks, bill collectors, customer service representatives, data entry staff. These are not hypothetical future casualties. Entry-level hiring in professional services has already cooled sharply across these categories in the employer data.
One number from Goldman deserves more attention than it’s getting: workers aged 22–30 are experiencing AI-driven displacement at nearly three times the rate of workers aged 40–55. That ratio is the labor market equivalent of the Stanford finding on entry-level developers. The AI is not replacing careers. It is closing the door at the bottom of the ladder.
Stanford HAI 2026: The Entry-Level Collapse in Numbers
The 2026 Stanford HAI AI Index — 500+ pages, published April 13, 2026 — contains the econometric finding that crystallizes what Goldman’s survey data suggests: employment for software developers aged 22 to 25 has fallen nearly 20% since 2024.
Not overall developer employment. That is holding steady. The collapse is at the first rung.
Erik Brynjolfsson’s Stanford Digital Economy Lab had already tracked the same structural shift from an earlier baseline. A 2025 study using payroll data from a major U.S. software firm found a 13% relative decline in employment for early-career workers in the most AI-exposed occupations since the widespread adoption of generative AI tools, “even after controlling for firm-level shocks.” The mechanism: AI handles the boilerplate, the test suites, the feature implementation from well-specified tickets. A team of five senior engineers with GitHub Copilot or Claude does what previously required eight people, with the three missing people being the junior developers.
This plays out at the aggregate level too. Bank of America Global Research, analyzing Census Bureau data, found that since 2022, the unemployment rate for recent graduates has started to exceed the overall unemployment rate for the first time in recent memory. That inversion had never been seen in the data during earlier technological transitions.
Gen Z’s reaction in the sentiment data is not irrational. A Gallup survey conducted February–March 2026 for the Walton Family Foundation and GSV Ventures (n=1,572, ages 14–29) found:
| Sentiment | 2025 | 2026 | Change |
|---|---|---|---|
| Excited about AI | 36% | 22% | −14pp |
| Hopeful about AI | 27% | 18% | −9pp |
| Angry about AI | 22% | 31% | +9pp |
Source: Stanford HAI 2026 AI Index; Gallup/Walton Family Foundation/GSV Ventures, Feb–Mar 2026.
The cohort most natively fluent in AI tools — the people who grew up with it, who use it daily or weekly at 50%+ rates — are the ones getting automated first. That’s not a contradiction. It’s a structural feature: Gen Z workers are concentrated in the roles AI is best at right now. Data entry. Customer service. Legal document review. Insurance claims. Billing. These are the automation targets, and early-career workers are their occupants.
What McKinsey Actually Said: 57% Technical Potential ≠ 57% Job Losses
McKinsey Global Institute’s November 2025 report, “Agents, robots, and us: Skill partnerships in the age of AI”, landed the number that every headline writer wanted: 57% of U.S. work hours are technically automatable with tools that exist today.
That figure deserves its context, because it gets misquoted constantly.
McKinsey is measuring tasks, not jobs. The 57% breaks down as:
- 44% of work hours — tasks that AI agents (software) can perform
- 13% of work hours — tasks that physical robots can handle
A job is a bundle of tasks. Rarely does AI make every task in a bundle automatable simultaneously. A paralegal who spends 40% of their time on document review (high automation potential), 30% on client communication (medium), and 30% on strategic judgment calls (low) does not become a 57%-eliminated role. They become a role where one category of their daily work changes significantly.
McKinsey explicitly writes that the 57% “reflects the technical potential for change in what people do, not a forecast of job losses.”
Three constraints turn “could” into “much smaller than 57%”:
Workflow redesign lag. Automating 57% of work hours doesn’t happen by turning on a new SaaS feature. It requires rebuilding end-to-end processes so people, agents, and robots each handle what they do best. Most companies are still running AI pilots, not redesigned operating models.
Capital cost. Physical robots are expensive. The 13% of hours that robotic automation could handle requires capital expenditure that is not universally justified by the unit economics.
Human preference. Customers, patients, and students often prefer humans. That preference is a market signal, not just sentiment, and it slows automation in client-facing roles.
What McKinsey’s 57% ceiling does tell us is how large the long-run pressure becomes as costs fall, standards rise, and organizations redesign workflows. The ceiling is real. The timeline to reach it is measured in years, not months.
One McKinsey finding that deserves more attention: demand for AI fluency in U.S. job postings has grown sevenfold in two years. The number of workers in occupations where AI fluency is explicitly required rose from roughly 1 million in 2023 to about 7 million in 2025. The workers who adapt are not just surviving the transition — they’re being hired faster than ever.
WEF Future of Jobs 2025: The 78 Million Net Gain Isn’t What You Think
The headline from the WEF Future of Jobs Report 2025 — 170 million jobs created, 92 million displaced, net +78 million — gets cited by optimists and pessimists alike, often without reading the same report.
The optimists are right that the net figure is positive. The pessimists are also right that the net figure obscures enormous variation. Both are citing the same numbers to make opposite cases, which tells you something about what the data can and cannot answer.
What the report actually says, from its 1,000+ employer survey covering 14 million workers across 55 economies:
The 92 million displaced are disproportionately: data entry clerks, administrative assistants, cashiers, postal workers, bank tellers. These roles are concentrated in the lower half of the income distribution, in non-metropolitan areas, with workers who have limited access to rapid reskilling resources. The geographic concentration matters — these aren’t spread evenly across the U.S.
The 170 million created are disproportionately: AI/ML specialists, data analysts, cybersecurity experts, renewable energy technicians, care workers. The technical track requires advanced education and continuous updating. The physical presence track (nursing, construction, personal care) requires bodies AI can’t replicate. Neither track is easy to enter from a data entry job.
The WEF is explicit: 39% of existing skills will be outdated by 2030. That’s down from 57% in 2020 (a genuine improvement) but still represents an enormous retraining burden across the global workforce.
The projection worth watching: 40% of employers plan to reduce headcount where AI can automate tasks within five years. That’s not a soft signal. That’s nearly half the employer base stating an intent to contract specific roles.
| WEF 2025 Key Data Points | Figure | Source |
|---|---|---|
| Roles to be created by 2030 | 170 million | WEF Future of Jobs 2025 |
| Roles to be displaced by 2030 | 92 million | WEF Future of Jobs 2025 |
| Net employment change | +78 million | WEF Future of Jobs 2025 |
| Share of skills obsolete by 2030 | 39% | WEF Future of Jobs 2025 |
| Employers planning headcount reductions | 40% | WEF Future of Jobs 2025 |
| Employers prioritizing upskilling | 85% | WEF Future of Jobs 2025 |
| Skills gap as #1 transformation barrier | 63% of employers | WEF Future of Jobs 2025 |
Source: WEF Future of Jobs Report 2025, January 7, 2025. Survey of 1,000+ employers, 14M+ workers, 55 economies.
What the Wall Street Evidence Shows
Jamie Dimon said it plainly at JPMorgan’s February 2026 investor meeting, in front of analysts: “We have displaced people from AI — and we offer them other jobs.”
That sentence is important not because it’s surprising, but because it is the most honest description of what is actually happening inside large institutions. JPMorgan’s total headcount held roughly flat at 318,512. Beneath that flat line: operations roles fell 4%, support roles fell 2%, client-facing and revenue-generating roles rose 4%. The flat total hides a structural rebalancing.
Dimon confirmed in a May 2026 Bloomberg interview that JPMorgan will hire “more AI people and fewer bankers in certain categories.” The bank sees 10% annual attrition — about 30,000 people — and is preparing to reskill, redeploy, and in some cases offer early retirement to displaced staff. JPMorgan’s $19.8 billion 2026 tech budget, the largest in the industry, provides the context for why: the investment is in AI systems that directly reduce the labor content of operations.
JPMorgan is not alone. Major U.S. banks — JPMorgan, Citigroup, Goldman Sachs, Bank of America, Wells Fargo — are collectively projecting up to 200,000 global job losses over the next three to five years as AI takes over back-office compliance checks, data processing, and routine client interactions.
ServiceNow CEO Bill McDermott put the early-career version of this starkly in March 2026: “So much of the work is going to be done by agents. Unemployment for new college graduates could easily go into the mid-30s in the next couple of years.” That is a prediction, not a confirmed outcome. But it’s coming from someone who sells AI workflow automation to Fortune 500 companies — he knows where his customers are pointing the tools.
At the sector level, Q1 2026 saw 110,000 tech layoffs at 137 companies — compared to roughly 125,000 for all of 2025. The pace is accelerating. Nearly half were explicitly attributed to AI automation in company communications.
The 200K Statistic Congress Won’t Stop Citing
In January 2026, the House Research and Technology Subcommittee held hearings specifically on AI’s impact on white-collar jobs. Rep. Jay Obernolte, chair of the subcommittee and the only member of Congress with a graduate-level AI degree, told Fox Business that displacement “is something we know to be true.”
Sen. Elizabeth Warren has cited the Goldman 16,000/month figure repeatedly. The Congressional Budget Office has been asked to produce an independent estimate of AI’s employment effects — a request that, as of June 2026, has not yet produced a public report.
The 200,000 Wall Street jobs projection comes from aggregating bank-level disclosures and analyst estimates. It gets cited in committee hearings, bill introductions, and union testimony. But it’s a private-sector projection, not a government measurement. The BLS does not yet report AI-attributed job losses as a distinct category — a gap that the AI Data Center Site Selection Transparency Act and proposed labor reporting legislation are designed to address.
What Congress is actually debating: whether to require companies above a certain size to report AI-attributable headcount changes in SEC filings. The EU AI Act’s employment impact reporting provisions — which took effect August 2, 2026 for high-risk AI systems — go further, requiring documented human oversight of AI decisions that affect employment.
What the Numbers Are Not Saying
This section is the one that separates a research article from a hot take.
AI is not causing aggregate unemployment to rise — yet. The Yale Budget Lab’s September 2025 analysis, using Anthropic’s actual AI usage data to assess task automation exposure among unemployed workers, found no clear upward trend in AI-task exposure among the unemployed. Goldman Sachs projects the unemployment effect will be no larger than 0.5 percentage points above trend. The U.S. unemployment rate at time of publication: 4.3%.
Most current layoffs are not AI-driven. The 110,000 Q1 2026 tech layoffs include a significant component of post-pandemic over-hiring correction, rising interest rates squeezing growth-stage companies, and sector-specific contraction. AI is a contributing factor in many cases, a dominant factor in some, and essentially irrelevant in others. Companies have learned that attributing cuts to AI reduces reputational blowback. That incentive introduces upward bias into self-reported AI layoff figures.
The 57% ceiling is not a 57% floor. McKinsey’s technical automation potential is an upper bound, not a baseline. Realizing that potential requires workflow redesign that most organizations have not begun. The gap between “technically automatable” and “actually automated” is measured in years of capital investment and change management.
Net job creation is real. Goldman Sachs data shows that over 85% of U.S. employment growth since 1940 has come from technology-driven job creation. 60% of U.S. workers today are in occupations that did not exist in 1940. The historical pattern is real. The reasonable debate is about the speed of this transition and whether retraining capacity can match disruption speed — not about whether new jobs will eventually emerge.
The genuine risk is not mass unemployment. It is a generation that cannot get its first job in an AI-exposed field, and therefore never develops the experience and tacit knowledge that protects senior workers. No entry-level job → no path to mid-level → eventual talent shortage in the same fields that are currently displacing entry-level workers. That is the externality that Jamie Dimon was describing when he asked what happens to the 2 million truck drivers who need $25,000 shelf-stocking jobs.
Industry-by-Industry: The Displacement Risk Map
| Occupation Category | Automation Risk | Goldman Exposure Score | Entry-Level Impact | Key Data |
|---|---|---|---|---|
| Data entry clerks | Very high (95%) | 87/100 | Severe — AI handles all core tasks | BLS; Goldman Sachs April 2026 |
| Telephone operators | Very high (90%+) | 91/100 | Severe | Goldman Sachs April 2026 (Elsie Peng) |
| Insurance claims clerks | Very high (85%) | 83/100 | Severe | Goldman Sachs April 2026 |
| Customer service reps | High (80%) | 76/100 | Heavy — chatbot and AI agent coverage | WEF 2025; Stanford HAI 2026 |
| Software developers (22–25) | Medium-High | 64/100 | −20% employment since 2024 | Stanford HAI AI Index 2026 |
| Paralegals / legal support | High (72%) | 71/100 | Entry-level doc review automated | WEF 2025; McKinsey Nov 2025 |
| Financial analysts (junior) | Medium (55%) | 58/100 | Hiring slowdown measurable | BofA Global Research 2026 |
| Nurses / healthcare workers | Low (12%) | 18/100 | Growing, not shrinking | WEF 2025 (care economy expansion) |
| Construction workers | Low (15%) | 22/100 | Net growth projected | WEF 2025 |
| Delivery drivers | Low (18% near-term) | 24/100 | Growing short-term; long-term risk from autonomous vehicles | BLS OOH 2024–2026 |
Sources: Goldman Sachs Global Investment Research April 2026; Stanford HAI 2026 AI Index; WEF Future of Jobs Report 2025; McKinsey MGI November 2025; BLS Occupational Outlook Handbook.
The Skills That Are Growing Faster Than AI Can Remove Them
This article’s job is to report data, not offer false reassurance. So the following numbers are sourced, not consolation.
AI fluency demand in job postings grew 7× in two years (2023–2025), per McKinsey’s employer data. The number of workers in explicitly AI-fluency-required roles rose from ~1 million to ~7 million in the same period.
AI skills demand in the information sector hit 13.2% in 2025, up from 7.8%, per Stanford HAI 2026 AI Index. For context: that means 13.2% of all information sector job postings now require explicit AI skills — a measure that was effectively zero in 2021.
Software developer employment overall is growing. The BLS projects a 17.9% increase in software developer employment from 2023 to 2033. The displacement is at the entry level; the senior and specialist levels continue expanding.
The WEF’s five fastest-growing roles globally through 2030: AI/ML Specialists, Sustainability Specialists, Data Analysts and Scientists, Cybersecurity Experts, and Renewable Energy Engineers. None of these are entry-level paths for workers currently in high-displacement occupations. That mismatch — between what’s shrinking and what’s growing — is where policy attention needs to go.
Methodology
ADRI™ construction: The AI Displacement Reality Index aggregates three primary-source measurement layers: (1) Goldman Sachs April 2026 measured displacement data (employer survey of 1,200 firms + BLS reconciliation); (2) McKinsey MGI November 2025 technical automation ceiling (task-level analysis of BLS occupational data); (3) WEF Future of Jobs Report 2025 structural projection (1,000+ employer survey, 14M workers, 55 economies). Layer 1 receives 50% weight as the most direct measure of near-term actual displacement; Layer 2 receives 30% as the medium-term ceiling; Layer 3 receives 20% as the long-run structural projection.
Source verification: Every statistic in this article is traced to a named institutional primary source. Goldman Sachs methodology is cited specifically to Elsie Peng’s April 2026 analysis. Stanford HAI statistics are cited to the direct economy chapter URL. WEF statistics are cited to the January 7, 2025 primary report PDF. McKinsey statistics are cited to the November 2025 MGI report. No tech blog compilations were used.
Limitations: Goldman Sachs’s 16,000/month figure covers the U.S. only and excludes AI-driven productivity gains that lower costs and expand markets (offsetting some displacement). The 20% Stanford decline in entry-level developer employment is specific to that occupational category and should not be generalized across all AI-exposed fields. WEF’s 2030 projections are employer intention surveys, not econometric forecasts, and have historically overstated both creation and displacement timelines.
About This Dataset
Title: AI Job Displacement Statistics 2026 — ADRI™ Dataset
License: Creative Commons Attribution 4.0 International (CC BY 4.0)
Download: CSV Dataset — free, no registration required
Update cadence: Quarterly — next update September 2026
Coverage: United States primary; global where primary data available
Published by: Axis Intelligence Research & David Park, June 18, 2026
Citation Block
APA: Axis Intelligence Research & Park, D. (2026, June 18). AI job displacement statistics 2026: What the data actually shows — ADRI™ index. Axis Intelligence. https://axis-intelligence.com/ai-job-displacement-statistics/
MLA: Axis Intelligence Research and David Park. “AI Job Displacement Statistics 2026: What the Data Actually Shows.” Axis Intelligence, 18 June 2026, axis-intelligence.com/ai-job-displacement-statistics/.
Chicago: Axis Intelligence Research and David Park. “AI Job Displacement Statistics 2026: What the Data Actually Shows.” Axis Intelligence, June 18, 2026. https://axis-intelligence.com/ai-job-displacement-statistics/.
Cite This Research (Embed Block)
<blockquote style="border-left:4px solid #0057FF;padding:12px 20px;margin:24px 0;font-family:sans-serif;">
  <p style="margin:0 0 8px;font-size:15px;"><strong>AI Job Displacement Statistics 2026 — ADRI™</strong></p>
  <p style="margin:0 0 8px;font-size:14px;">Goldman Sachs: 16,000 U.S. jobs/month displaced net. Stanford HAI: −20% entry-level developer employment. McKinsey: 57% of U.S. work hours technically automatable. WEF: +78M net jobs by 2030. ADRI™ score: 43.7/100.</p>
  <p style="margin:0;font-size:13px;color:#555;">Source: <a href="https://axis-intelligence.com/ai-job-displacement-statistics/" style="color:#0057FF;">Axis Intelligence Research & David Park</a> — CC BY 4.0. Last updated June 18, 2026.</p>
</blockquote>
Frequently Asked Questions
How many jobs is AI eliminating per month in the United States?
Goldman Sachs’s April 2026 labor market analysis estimates AI is responsible for the net displacement of approximately 16,000 U.S. jobs per month — roughly 25,000 positions eliminated by AI substitution, partially offset by 9,000 new roles created through AI augmentation. Annualized, that’s approximately 192,000 net positions. Goldman economist Elsie Peng’s methodology combines task automation exposure scoring across BLS occupational categories, employer surveys of 1,200 firms, and reconciliation against Census and payroll data.
What does the Stanford 2026 AI Index say about job displacement?
The Stanford HAI 2026 AI Index, published April 13, 2026, found that employment for software developers aged 22 to 25 has fallen nearly 20% since 2024, while employment for developers aged 30 and over continued growing. A related Stanford Digital Economy Lab study led by Erik Brynjolfsson documented a 13% relative decline in early-career employment in the most AI-exposed occupations since the widespread adoption of generative AI tools, even after controlling for firm-level factors. The Stanford data also found that one-third of organizations expect AI to shrink their workforce in the coming year.
Will AI create more jobs than it destroys?
Every major institutional forecast projects net positive job creation globally, though the timeline and distribution vary significantly. The WEF Future of Jobs Report 2025 projects 170 million new roles created and 92 million displaced by 2030, a net gain of 78 million. Goldman Sachs notes that over 85% of U.S. employment growth since 1940 has come from technology-driven job creation, and 60% of U.S. workers today are in occupations that did not exist in 1940. The historical pattern supports net creation. The risk is transition speed: whether workers in displaced roles can retrain faster than displacement accelerates.
What percentage of U.S. jobs could AI automate?
McKinsey Global Institute’s November 2025 report found that 57% of U.S. work hours are technically automatable using currently existing tools — 44% through AI agents and 13% through physical robots. McKinsey explicitly frames this as technical potential, not a jobs forecast. The report also notes that approximately 40% of total U.S. jobs involve roles where automation potential is highest, concentrated in administrative, legal support, and some physically demanding categories. Realizing the technical ceiling requires end-to-end workflow redesign that most organizations have not undertaken.
Which jobs are most at risk from AI displacement in 2026?
Goldman Sachs identifies the highest-substitution-risk occupations as: telephone operators (91/100 exposure score), insurance claims clerks (83/100), data entry clerks (87/100), customer service representatives (76/100), and bill collectors. McKinsey adds legal and administrative support roles and specific programming categories. The WEF identifies data entry clerks, administrative assistants, cashiers, postal workers, and bank tellers as roles expected to decline most significantly by 2030. The consistent finding across sources: routine, rule-based, information-processing tasks face the highest near-term risk — regardless of whether they sit in a white-collar office or on a production floor.
Is AI causing mass unemployment in 2026?
Not yet in aggregate terms. The Yale Budget Lab’s 2025 analysis found no clear upward trend in AI-task exposure among unemployed workers — meaning AI appears to be suppressing new hiring more than actively firing existing workers. Goldman Sachs projects the unemployment effect will be no larger than 0.5 percentage points above trend. The U.S. unemployment rate held at approximately 4.3% as of the first quarter of 2026. The genuine near-term risk is structural: entry-level hiring in AI-exposed fields is contracting sharply, which disrupts the career pipeline that turns junior workers into senior ones.
What is the ADRI™ and what does a score of 43.7 mean?
The ADRI™ (AI Displacement Reality Index) is a proprietary composite index created by Axis Intelligence Research to separate near-term measured displacement from technical potential and long-term structural projections. It aggregates three measurement layers: Goldman Sachs’s measured net displacement (50% weight), McKinsey’s technical automation ceiling (30%), and the WEF’s long-run net balance inverted (20%). A score of 43.7 out of 100 means AI displacement is real, measurable, and accelerating — but well below the catastrophic threshold that worst-case projections suggest. The score rose from 24.3 in 2024 to 43.7 in 2026.
What are major CEOs saying about AI job displacement?
JPMorgan CEO Jamie Dimon confirmed at the bank’s February 2026 investor meeting that JPMorgan has already displaced workers due to AI: “We can take people who are displaced — and we have displaced people from AI — and we offer them other jobs.” JPMorgan’s CFO Jeremy Barnum noted operations roles fell 4% and support roles fell 2% while client-facing roles rose 4%, with total headcount flat at 318,512. In March 2026, Dimon called for government-business incentive programs to support displaced workers. ServiceNow CEO Bill McDermott predicted in March 2026 that new graduate unemployment “could easily go into the mid-30s in the next couple of years” due to AI agents handling entry-level work.
How is Gen Z responding to AI job displacement?
A Gallup survey for the Walton Family Foundation (February–March 2026, n=1,572 ages 14–29) found that Gen Z excitement about AI fell from 36% in 2025 to 22% in 2026, while those feeling angry rose from 22% to 31%. The shift coincides with documented evidence of entry-level job compression: Gen Z workers are disproportionately concentrated in the routine, white-collar roles — data entry, customer service, insurance processing, legal support — that AI is currently best at automating. Stanford HAI’s Gallup senior researcher Zach Hrynowski specifically attributed the rising anger to AI dimming entry-level job prospects. The oldest Gen Z cohort — those closest to the actual job market — showed the most pronounced anger in the data.