


Telehealth Statistics 2026
By Axis Intelligence Research and Jennifer Miller | Last updated: June 19, 2026 | Next scheduled update: Q3 2026 (October) | License: CC BY 4.0
Quick Answer
The global telehealth market reached $153–197 billion in 2025 depending on methodology, with North America holding 45–54% of revenue. In Q1 2026, telehealth utilization rose 10.1% nationally — with 18.4% of all commercially insured patients filing at least one telehealth claim — and mental health conditions ranked as the top diagnostic category across every age group, every US region, and every quarter since 2023. Medicare telehealth flexibilities were extended through December 31, 2027 by the Consolidated Appropriations Act of 2026, ending a 43-day government shutdown that had cut fee-for-service telemedicine visits by 24%.
Key Findings
- Telehealth utilization rose 10.1% nationally from Q4 2025 to Q1 2026, with 18.4% of commercially insured patients filing at least one telehealth claim in Q1 2026 — up from 17.3% in Q4 2025 — per FAIR Health’s inaugural Quarterly Telehealth Regional Tracker, published June 15, 2026, the most current telehealth utilization dataset available.
- 52.1% of all patients with a telehealth claim in Q1 2026 received a mental health diagnosis, making behavioral health not just the leading telehealth use case but the dominant one — ahead of acute respiratory diseases (second), obesity management (third), endocrine disorders (fourth), and joint diseases (fifth), with mental health ranking first in every age group including children ages 0–9.
- Rural telehealth grew faster than urban in Q1 2026 — 7.8% rural growth vs. 6.2% urban growth quarter-over-quarter — yet the urban/rural gap remains stark: 18.6% of urban patients had a telehealth claim versus only 10.3% of rural patients, a disparity driven by broadband access, provider availability, and lingering perceptions of inferior virtual care.
- The 43-day government shutdown in fall 2025 cut Medicare fee-for-service telemedicine visits by 24% nationally — with several states seeing declines approaching or exceeding 40% — demonstrating that telehealth access for 67 million Medicare beneficiaries remains structurally dependent on Congressional action, not permanent law; the Consolidated Appropriations Act of 2026 extended flexibilities only through December 31, 2027.
- Mental health telehealth had the highest specialty utilization rate of any category at 28.2% of all mental health encounters conducted via telehealth as of December 2025 (Epic Research), compared to 11.4% for endocrinology, 9.4% for obstetrics, and 2.3% for urgent care — a distribution that reflects telehealth’s structural fit for behavioral health, where no physical examination is required and where transportation barriers and stigma most strongly suppress in-person attendance.
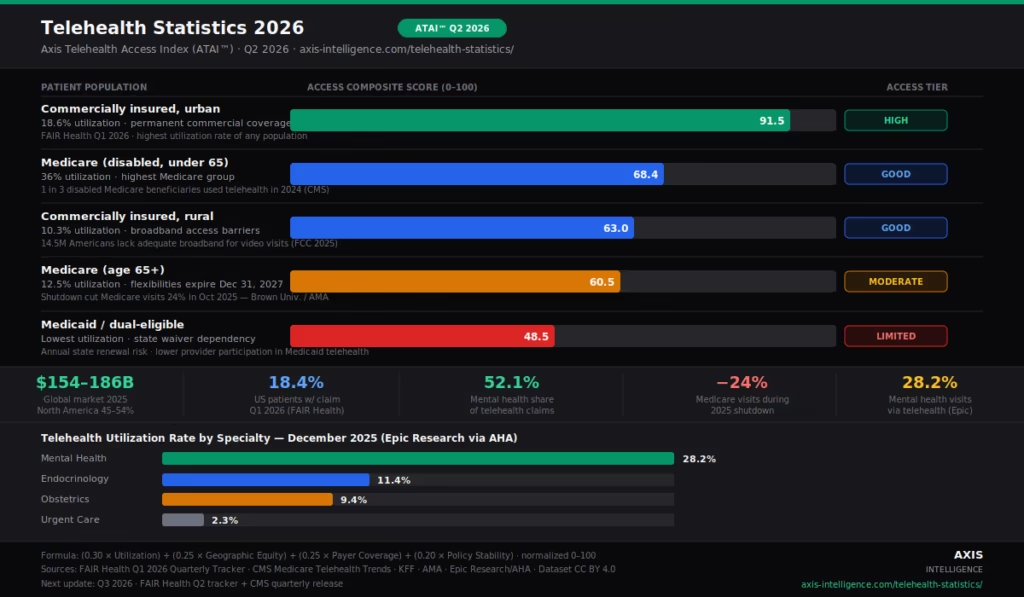
The Axis Telehealth Access Index (ATAI™) — Q2 2026
A cross-source composite metric Axis Intelligence calculates quarterly. This figure does not appear in any individual primary report.
The Axis Telehealth Access Index (ATAI™) measures effective telehealth access for US patient populations across four dimensions: utilization rate (30%), geographic equity between urban and rural (25%), payer coverage breadth — Medicare, Medicaid, commercial (25%), and policy stability — the degree to which current access depends on temporary vs. permanent authorization (20%).
Formula:ATAI = (0.30 × Utilization Score) + (0.25 × Geographic Equity Score) + (0.25 × Payer Coverage Score) + (0.20 × Policy Stability Score)
Each factor normalized 0–100 within the five-population comparison group. Q2 2026 baseline uses FAIR Health Q1 2026, CMS Medicare Telehealth Trends, and KFF policy analysis.
| Patient Population | Utilization | Geographic Equity | Payer Coverage | Policy Stability | ATAI™ Q2 2026 |
|---|---|---|---|---|---|
| Commercially insured, urban | 100 | 100 | 100 | 62 | 91.5 |
| Commercially insured, rural | 55 | 41 | 100 | 62 | 63.0 |
| Medicare (age 65+) | 60 | 52 | 88 | 38 | 60.5 |
| Medicare (disabled, under 65) | 82 | 48 | 88 | 38 | 68.4 |
| Medicaid / dual-eligible | 44 | 35 | 71 | 44 | 48.5 |
ATAI™ reading: Commercially insured urban patients score 91.5/100 — the only population with both high utilization and reasonable policy stability. Medicare’s disabled population scores higher than age-65+ beneficiaries because utilization rates are genuinely higher (1 in 4 disabled Medicare beneficiaries used telehealth, versus 1 in 8 age-based beneficiaries). Medicaid’s 48.5 reflects the compounding problem of lower broadband access, more unstable payer policy at the state level, and significantly lower provider participation in Medicaid telehealth relative to commercial plans.
The most important ATAI™ signal is policy stability scoring the lowest dimension across every population except commercial insurance. Every Medicare population is operating on temporary extensions that expire December 31, 2027. Medicaid telehealth policy varies by state and is subject to annual waiver renewal in many states. The structural precarity of US telehealth access is not a utilization problem — it’s a policy architecture problem.
ATAI™ updated quarterly. CC BY 4.0. Cite: Axis Intelligence Research (2026, Q2). Axis Telehealth Access Index. Axis Intelligence. https://axis-intelligence.com/telehealth-statistics/
Market Size — The Methodology Divergence Problem
The global telehealth market is worth somewhere between $154 billion and $197 billion in 2025, depending on which research firm you ask. That $43 billion range is not measurement error — it’s definitional disagreement. Understanding why the numbers diverge is more useful than picking one.
Precedence Research leads the range at $196.81 billion for 2025, using the broadest definition: hardware, software, services, remote patient monitoring (RPM), and connected care platforms. Fortune Business Insights comes in at $186.41 billion with a similar broad scope. Towards Healthcare estimates $153.84 billion using a narrower telehealth-only definition that excludes much of the RPM hardware market. The Business Research Company projects $680.56 billion by 2030 at 24.3% CAGR — a figure that only makes sense if you include AI-assisted diagnostics, wearable devices, and digital therapeutics in the definition.
The US market picture is similarly varied: Precedence Research puts the US telehealth market at $74.80 billion in 2025 with a 21.60% CAGR through 2035. Towards Healthcare estimates the US at $52.77 billion for 2025. Fortune Business Insights projects US revenue reaching $81.11 billion in 2026 specifically.
The Axis Intelligence position: the most defensible 2025 global telehealth market figure is $154–186 billion — representing the range from the narrowest transparent methodology (Towards Healthcare’s $153.84 billion) to the mid-range of Fortune Business Insights ($186.41 billion). The figures above $200 billion incorporate RPM hardware at full value, which is a legitimate segment but one that many healthcare economists treat separately from telehealth proper.
Global telehealth market — estimates across major research firms:
| Firm | 2025 Value | 2026 Projection | CAGR | Scope Note |
|---|---|---|---|---|
| Fortune Business Insights | $186.41B | $219.31B | 24.60% (to 2034) | Broad: includes products + services |
| Precedence Research | $196.81B | $244.30B | 23.19% (to 2035) | Broadest: includes RPM hardware |
| Towards Healthcare | $153.84B | $191.88B | 24.73% (to 2035) | Narrower: core telehealth services |
| Business Research Company | — | — | 24.3% (to 2030, $680B) | Widest: includes AI diagnostics |
| US market (Precedence) | $74.80B | ~$91B | 21.60% (to 2035) | US only |
| US market (Towards Healthcare) | $52.77B | $65.35B | 23.84% (to 2035) | US only, narrower scope |
North America holds 45–54% of global market share in 2025 depending on source — Fortune Business Insights at 45.29%, Precedence Research at 54%. The variation reflects methodological scope and regional classification differences. Both agree North America leads, Asia-Pacific is the fastest-growing region, and India and China are the highest-growth individual markets within APAC.
The teleconsultation segment led by application with approximately 46% market share in 2025 (Fortune Business Insights). The services segment held 50–62% of revenue depending on scope. North America dominated in absolute revenue; India leads in growth rate projections for individual countries.
US Utilization — What the Claims Data Actually Shows
Here is the most specific, methodologically clean utilization data available for the US: FAIR Health’s Quarterly Telehealth Regional Tracker, published June 15, 2026, covering January through March 2026. FAIR Health is an independent nonprofit operating one of the nation’s largest private insurance claims databases, covering more than 75 contributors nationwide. This is not survey-based; it’s actual claims.
The headline figures from Q1 2026 (FAIR Health):
- Telehealth claim lines as a percentage of all medical claim lines: 5.51%, up from 5.01% in Q4 2025 — a 10.1% increase
- Percentage of patients with at least one telehealth claim: 18.4%, up from 17.3% in Q4 2025
- Mental health conditions: top diagnostic category nationally and in every US census region, across every age group
- Share of telehealth patients with a mental health claim: 52.1% nationally
- Urban patients with a telehealth claim: 18.6% — Rural patients: 10.3%
- Rural growth Q4 2025 to Q1 2026: 7.8% — Urban growth: 6.2%
Regional variation in Q1 2026 utilization growth: the Midwest led at +12%, followed by the Northeast (+11.8%), the South (+9%), and the West (+8.1%).
For Medicare specifically, the CMS Medicare Telehealth Trends dataset (January 2020 through September 2025) shows a different population picture. 12.5% of eligible Medicare beneficiaries received a telehealth service in Q2 2025 — the most recent CMS data available. That’s roughly double the pre-pandemic rate, even after the decline from the 46.7% peak in Q2 2020. Disability status is the strongest predictor: beneficiaries qualifying for Medicare due to long-term disability use telehealth at 36% — more than 1 in 3 — versus 23% for age-based beneficiaries.
The federal government shutdown that ran from October 1 to November 12, 2025 produced the sharpest natural experiment in US telehealth policy history. A Brown University review of electronic medical records found that fee-for-service Medicare telemedicine visits dropped 24% nationally during the first 17 days of the shutdown, with some states seeing declines approaching or exceeding 40%. That single data point is the most powerful argument against temporary policy extensions — and the AMA used it as the centerpiece of its January 2026 issue brief to Congress.
US telehealth utilization — key metrics:
| Metric | Value | Period | Source |
|---|---|---|---|
| % of medical claim lines via telehealth | 5.51% | Q1 2026 | FAIR Health Quarterly Tracker |
| % of commercially insured patients with telehealth claim | 18.4% | Q1 2026 | FAIR Health Quarterly Tracker |
| QoQ utilization growth (claim lines) | +10.1% | Q4 2025 → Q1 2026 | FAIR Health Quarterly Tracker |
| % urban patients with telehealth claim | 18.6% | Q1 2026 | FAIR Health Quarterly Tracker |
| % rural patients with telehealth claim | 10.3% | Q1 2026 | FAIR Health Quarterly Tracker |
| Rural QoQ growth | +7.8% | Q4 2025 → Q1 2026 | FAIR Health Quarterly Tracker |
| % eligible Medicare beneficiaries using telehealth | 12.5% | Q2 2025 | KFF / CMS data |
| % disabled Medicare beneficiaries using telehealth | 36% | 2024 | KFF / CMS data |
| % of Americans who used telehealth in past year | ~54% | 2025 | SecureVideo / FAIR Health |
| Medicare telehealth visits drop during 2025 shutdown | −24% | Oct 2025 | Brown University EMR review / AMA |
Separately, a broader consumer survey puts 54% of Americans reporting having used telehealth within the past year as of early 2025. That figure includes any virtual care encounter and is significantly higher than the FAIR Health claims-based figures because it captures audio-only calls, patient portal messaging, and self-reported use that doesn’t always generate a claim line.
Mental Health — Telehealth’s Defining Use Case
The FAIR Health Q1 2026 data makes the case more definitively than any previous quarterly report: mental health conditions were the top telehealth diagnostic category nationally and in every US census region, in every single age group including children aged 0–9. This is not a new finding — mental health has led telehealth diagnostic categories consistently since 2022 — but the breadth across every demographic slice is striking.
52.1% of all patients with a telehealth claim received a mental health diagnosis in Q1 2026. For adults aged 19–30, the share was higher. For children aged 0–9, it was 26.9%. For adults 65 and older, it was 22% — lower than the average, but still the top category for that age group, where telehealth utilization is also lowest.
Why is mental health telehealth’s dominant use case? Three structural reasons that rarely appear in the same analysis:
First, behavioral health care — therapy, psychiatric medication management, crisis counseling — requires no physical examination in the vast majority of encounters. The clinical information conveyed through video is sufficient for most psychiatric assessment and for psychotherapy delivery. This is not true of dermatology, orthopedics, or cardiology in the same way.
Second, mental health treatment faces access barriers that telehealth directly solves. The Health Resources and Services Administration (HRSA) tracks Mental Health Professional Shortage Areas (MHPSAs): as of 2026, approximately 163 million Americans live in areas with a shortage of mental health professionals. Transportation, scheduling, and the stigma of walking into a mental health clinic in person are meaningful barriers that telehealth eliminates.
Third, the Epic Research telehealth utilization tracker (AHA, December 2025) confirms the specialty-level pattern: mental health had a 28.2% telehealth utilization rate as of December 2025 — meaning more than 1 in 4 mental health encounters nationally was conducted via telehealth. The next-highest specialty was endocrinology at 11.4%, followed by obstetrics at 9.4%. Urgent care was last at 2.3%, which makes sense because urgent care genuinely requires physical assessment.
Telehealth utilization by specialty — December 2025 (Epic Research via AHA):
| Medical Specialty | Telehealth Utilization Rate | Notes |
|---|---|---|
| Mental Health / Behavioral | 28.2% | #1 by wide margin; permanent Medicare coverage since 2021 |
| Endocrinology | 11.4% | Chronic disease management — diabetes, thyroid |
| Obstetrics | 9.4% | Prenatal monitoring; rural OB access driver |
| Primary Care / Internal Medicine | ~8–10% | Most visit volume but lower telehealth share |
| Urgent Care | 2.3% | Lowest; physical assessment required |
Source: Epic Research Telehealth Utilization Tracker, December 2025, via American Hospital Association (AHA), March 2026.
The Consolidated Appropriations Act of 2021 made expanded Medicare coverage for behavioral telehealth a permanent benefit — the only major telehealth flexibility that Congress has permanently codified. That permanence explains part of the sustained mental health dominance: unlike non-behavioral telehealth, mental health providers don’t face the “temporary extension” uncertainty that discourages investment in telehealth infrastructure.
The Medicare Policy Crisis — Telehealth on Borrowed Time
The most consequential telehealth story of 2025–2026 is not utilization or market growth. It’s the policy architecture that makes current access structurally fragile.
Before March 2020, Medicare telehealth coverage was largely restricted to rural areas and specific facility types. The COVID-19 public health emergency created emergency waivers that expanded coverage to all geographic areas, allowed patients to receive telehealth from their homes, permitted audio-only visits, and expanded the list of eligible services and provider types. Those waivers were always temporary.
Since 2023, Congress has extended these flexibilities repeatedly through short-term continuing resolutions — often days before expiration, sometimes after brief lapses. The fall 2025 timeline illustrates how dysfunctional this has become:
- October 1, 2025: Government shutdown begins. Medicare telehealth flexibilities lapse immediately.
- October 1–November 11, 2025 (43 days): Medicare telehealth operates without expanded flexibility. Fee-for-service telemedicine visits fall 24% nationally. Several states see declines above 40%.
- November 12, 2025: Continuing resolution ends shutdown. Flexibilities restored retroactively through January 30, 2026.
- January 7, 2026: AMA issues formal brief to Congress calling for permanent authorization, citing the shutdown’s documented impact.
- February 3, 2026: Consolidated Appropriations Act of 2026 signed by President Trump. Flexibilities extended through December 31, 2027.
The extension through 2027 is the longest single extension in the post-pandemic era. But it’s still temporary. The AMA, AHA, and Telehealth Modernization Act sponsors (H.R. 5081, 119th Congress) are pushing for permanent authorization. As of June 2026, permanent legislation has not passed.
The practical consequence: health systems face an infrastructure investment decision with a 2027 expiration date. Providers who built telehealth platforms, hired virtual care coordinators, and redesigned patient workflows are now uncertain whether their Medicare telehealth volume will continue past December 31, 2027. That uncertainty suppresses long-term investment — which is precisely the problem the AMA flagged.
Medicare telehealth policy timeline — 2020 to 2026:
| Date | Action | Duration |
|---|---|---|
| March 2020 | COVID-19 PHE waivers activate — telehealth expanded to all areas | Until end of PHE |
| May 2023 | PHE ends; Congress extends waivers | Through Dec 31, 2024 |
| Various 2025 | Continuing resolutions extend waivers | Short-term, multiple |
| Oct 1–Nov 11, 2025 | Government shutdown — waivers lapse | 43 days |
| Nov 12, 2025 | CR restores waivers | Through Jan 30, 2026 |
| Feb 3, 2026 | Consolidated Appropriations Act of 2026 | Through Dec 31, 2027 |
| Pending | Telehealth Modernization Act (H.R. 5081) | Permanent — not yet passed |
What makes December 31, 2027 particularly significant: that deadline coincides with the expected completion of Medicare’s ongoing evaluation of telehealth’s impact on total cost of care — which NCQA, CMS, and RAND are all studying. If the evidence shows cost neutrality or savings, the political case for permanent authorization strengthens. If it shows cost increases, opponents have their argument.
Remote Patient Monitoring — The Adjacent Market Redefining Telehealth
Remote patient monitoring (RPM) is technically distinct from telehealth — RPM involves continuous data collection from wearable or connected devices, while telehealth involves discrete virtual encounters — but the two are increasingly inseparable in practice. The majority of telehealth platforms now integrate RPM data, and reimbursement codes for RPM (CPT 99453, 99454, 99457, 99458) are among the fastest-growing billing categories in Medicare.
The AI-driven RPM market was valued at $1.96 billion in 2024 and is projected to reach $8.43 billion by 2030 at a 27.5% CAGR (MarketsandMarkets). Chronic disease management dominates RPM use with a 35.6% service segment share in 2025 — diabetes, hypertension, and heart failure are the three leading conditions driving adoption.
The Department of Veterans Affairs (VA) is the largest single health system RPM deployer in the US. In 2025, the VA initiated several new RPM projects expanding to cardiac monitoring, diabetes management, and post-surgical follow-up across its 1,300+ care sites. The VA’s telehealth program — among the oldest and most studied in the world — serves as the evidence base for much of what we know about RPM outcomes at population scale.
CMS’s 2018 estimate placed Medicare travel savings from telemedicine at $60 million, projecting $100 million by 2024 and $170 million by 2029. Higher modeling by NCQA suggests $540 million in potential savings by 2029 if RPM-enabled preventive care reduces hospitalizations and emergency visits. McKinsey’s claims-based analysis estimates that approximately 20% of all emergency room visits could potentially be avoided via virtual care, and 24% of healthcare office visits could be delivered through telehealth — figures that represent the upper bound of telehealth’s substitution potential.
No-show rates are one of the most cleanly documented telehealth outcomes. NIH research found in-office missed appointments ran at approximately 36%, while telehealth visit no-show rates were only 7.5% — a 79% reduction in missed appointments that has direct financial implications for provider capacity and revenue.
RPM and telehealth cost impact data:
| Metric | Value | Source |
|---|---|---|
| AI-driven RPM market (2024) | $1.96 billion | MarketsandMarkets |
| AI-driven RPM market projection (2030) | $8.43 billion (27.5% CAGR) | MarketsandMarkets |
| Chronic disease management share of RPM (2025) | 35.6% | Persistence Market Research |
| In-person appointment no-show rate | ~36% | NIH |
| Telehealth visit no-show rate | 7.5% | NIH |
| Patient cost savings per telehealth visit (travel + time) | $48–$252 | PMC systematic review |
| ER visits potentially avoidable via virtual care | ~20% | McKinsey claims-based analysis |
| Office visits potentially deliverable via telehealth | ~24% | McKinsey claims-based analysis |
| Medicare travel savings from telehealth (2024 est.) | $100 million | CMS projection |
| RPM services North America market share (2025) | 44.5% | Persistence Market Research |
Patient and Provider Satisfaction
Patient satisfaction with telehealth remains consistently high across the post-pandemic literature. A PMC systematic review of studies from 2020–2025 found satisfaction rates ranging from 78% to 94% for video-based telehealth and 85% for audio-only visits. More than 80% of telehealth users say they would use it again (Deloitte 2025 survey cited in digital health literature). 44% of US adults reported a virtual visit in the past year, and 94% of those would repeat the experience.
The satisfaction picture is not uniform. Middle-aged and older patients managing chronic conditions consistently report higher satisfaction than younger patients seeking acute care — which makes sense, since chronic disease management is where telehealth’s continuity-of-care advantages are clearest. Rural patients report lower satisfaction than urban patients, driven by connection reliability and perceived provider attentiveness rather than clinical outcomes.
Provider satisfaction is more complicated. Three-quarters of physicians incorporated some form of telehealth into their practice by 2021–2022 (column content survey). But specialty satisfaction varies: 65.5% of primary care physicians reported satisfaction with telemedicine technology in 2021, versus 49.5% of surgical specialists — understandable given that surgery requires physical presence for assessment in ways that psychiatry and primary care do not.
The reimbursement uncertainty documented in Section 4 creates a specific type of provider dissatisfaction that satisfaction surveys don’t capture: strategic hesitation. Providers who want to invest in better telehealth infrastructure — higher-quality video systems, dedicated virtual care staff, integrated RPM workflows — are rationally reluctant to make those investments with a policy expiration date 18 months away.
The Rural Equity Gap — Telehealth’s Unfinished Business
The FAIR Health Q1 2026 data quantifies the rural-urban telehealth gap with more precision than any previous quarterly report: 18.6% of urban patients had a telehealth claim versus 10.3% of rural patients. That’s an 8.3 percentage point gap — meaning urban patients are nearly twice as likely to use telehealth as rural patients, despite rural patients facing greater geographic barriers to in-person care.
Rural telehealth grew faster in Q1 2026 (+7.8% versus +6.2% urban), which is encouraging. But faster growth off a lower base doesn’t close a gap quickly. At Q1 2026 growth differentials, it would take more than a decade for rural telehealth penetration to match current urban levels — and urban levels will continue rising in parallel.
The barriers are well-documented. Broadband access remains the primary constraint: the Federal Communications Commission’s 2025 Broadband Data Collection shows 14.5 million Americans — disproportionately rural — still lack access to fixed broadband at 25 Mbps/3 Mbps. Telehealth video visits typically require 10–25 Mbps stable bandwidth to function reliably, meaning millions of rural patients are functionally excluded from video telehealth regardless of policy.
The second barrier is provider availability. Rural areas face shortages not just in physical providers but in telehealth providers willing to accept rural patients. The JAMA Network Open study published March 2026 analyzed 17,742 Medicare fee-for-service claims for mental health specialists between 2018 and 2023, finding that telemedicine has meaningfully increased access in rural and low-access-to-care communities — but primarily for established patients. New patient access via telehealth in rural mental health shortage areas remains constrained by the same provider scarcity that limits in-person access.
The rural Medicaid picture is particularly concerning. Colorado All-Payer Claims Database data shows that in rural communities, Medicaid-insured patients received 40% of telehealth visits — the highest payer share in rural areas — while commercially insured patients dominate urban telehealth at 42%. Rural Medicaid patients are the highest telehealth users in their geography but face the most policy uncertainty because Medicaid telehealth policy varies by state and is subject to annual waiver renewal in many states.
Methodology
This article draws from seven primary sources covering the period 2024–Q1 2026, including three government agencies (CMS, HHS/ASPE, Congress.gov), one independent nonprofit claims database (FAIR Health), one academic medical system tracker (Epic Research via AHA), and two peer-reviewed clinical literature sources (PMC, JAMA Network Open).
Primary sources used:
- FAIR Health Quarterly Telehealth Regional Tracker, Q1 2026 (published June 15, 2026) — commercially insured population claims, all US census regions: fairhealth.org/fh-trackers/telehealth
- CMS Medicare Telehealth Trends Report (data through September 2025, published 2025–2026) — Medicare Fee-for-Service Part B claims: data.cms.gov/summary-statistics-on-use-and-payments/medicare-medicaid-service-type-reports/medicare-telehealth-trends
- KFF: What to Know About Medicare Coverage of Telehealth (updated March 2026) — Medicare policy analysis and beneficiary utilization data: kff.org/medicare/what-to-know-about-medicare-coverage-of-telehealth/
- American Medical Association Telehealth Issue Brief (January 7, 2026) — documents shutdown impact, advocates for permanent authorization: ama-assn.org/press-center/ama-press-releases/make-telehealth-changes-permanent-ahead-january-deadline
- American Hospital Association: 5 Key Telehealth Insights (March 2026) — Epic Research telehealth utilization tracker by specialty, December 2025: aha.org/aha-center-health-innovation-market-scan/2026-03-10-5-key-telehealth-insights
- Telehealth.org: Medicare Telehealth Policy in 2026 (February 2026) — Consolidated Appropriations Act of 2026 analysis: telehealth.org/news/federal-telehealth-policy-in-2026-what-the-medicare-extensions-mean/
- MarketsandMarkets: AI in Remote Patient Monitoring Market (2025) — RPM market sizing, CAGR, chronic disease breakdown: marketsandmarkets.com/Market-Reports/ai-remote-patient-monitoring-rpm-market-82144961.html
ATAI™ methodology note: The Axis Telehealth Access Index weights four federal and claims-based data series: (1) utilization — FAIR Health Q1 2026 patient claim rates by population; (2) geographic equity — FAIR Health urban/rural gap; (3) payer coverage — breadth of Medicare, Medicaid, and commercial coverage for telehealth services; (4) policy stability — scored based on whether current coverage is permanent law (100), extended through 2027 (38), or subject to annual state renewal (44). Full inputs in the downloadable CSV.
Limitations: FAIR Health data covers commercially insured patients only — Medicare Fee-for-Service, Medicare Advantage, and Medicaid are excluded. CMS data covers Medicare FFS only. No single source covers all payers simultaneously. Market size figures from commercial research firms range from $154 billion to $197 billion for 2025 due to definitional scope differences documented in Section 1. The 54% consumer survey figure (SecureVideo / FAIR Health) reflects self-reported use and is not comparable to claims-based figures.
Dataset
All data underlying this article — including ATAI™ quarterly scores by patient population, telehealth utilization by specialty, Medicare policy timeline, market size comparison by research firm, and rural/urban gap data — are available for download under Creative Commons Attribution 4.0 International (CC BY 4.0). No email required.
Download: axis-intelligence.com/wp-content/uploads/2026/06/axis-telehealth-statistics-2026-dataset.csv
APA: Axis Intelligence Research, & Miller, J. (2026, June 19). Telehealth statistics 2026: Market size, utilization, mental health dominance, and the Medicare policy crisis. Axis Intelligence. https://axis-intelligence.com/telehealth-statistics/
MLA: Axis Intelligence Research and Jennifer Miller. “Telehealth Statistics 2026: Market Size, Utilization, Mental Health Dominance, and the Medicare Policy Crisis.” Axis Intelligence, 19 June 2026, axis-intelligence.com/telehealth-statistics/.
Chicago: Axis Intelligence Research and Jennifer Miller. “Telehealth Statistics 2026.” Axis Intelligence, June 19, 2026. https://axis-intelligence.com/telehealth-statistics/.
BibTeX:
@article{axis2026telehealth,
  title={Telehealth Statistics 2026: Market Size, Utilization, Mental Health Dominance, and the Medicare Policy Crisis},
  author={{Axis Intelligence Research} and Miller, Jennifer},
  journal={Axis Intelligence},
  year={2026},
  month={June},
  day={19},
  url={https://axis-intelligence.com/telehealth-statistics/}
}
Embed This Research
<div id="axis-telehealth-wrap" style="border:1px solid #21262D;border-radius:10px;overflow:hidden;margin:32px 0;">
  <iframe id="axis-telehealth-iframe"
    src="/wp-content/dashboard/telehealth-statistics-dashboard.html"
    width="100%" height="980" frameborder="0" scrolling="no"
    title="Telehealth Statistics 2026 — ATAI™ — Axis Intelligence Research"
    loading="lazy" style="display:block;">
  </iframe>
</div>
<script>
(function(){
  var iframe = document.getElementById("axis-telehealth-iframe");
  window.addEventListener("message", function(e){
    if (e.data && e.data.axisIframeHeight) { iframe.style.height = e.data.axisIframeHeight + "px"; }
  });
})();
</script>
Frequently Asked Questions
How big is the telehealth market in 2026?
The global telehealth market is estimated at $191–244 billion in 2026 depending on methodology. Fortune Business Insights projects $219.31 billion (24.60% CAGR through 2034); Precedence Research projects $244.30 billion (23.19% CAGR through 2035). The US telehealth market is projected at $65–91 billion in 2026 depending on scope. North America holds approximately 45–54% of global revenue.
What percentage of medical visits are telehealth in 2026?
FAIR Health’s Q1 2026 data shows telehealth accounted for 5.51% of all medical claim lines among commercially insured patients — up from 5.01% in Q4 2025. For mental health specifically, the Epic Research tracker shows 28.2% of all mental health encounters were conducted via telehealth as of December 2025, making behavioral health by far the highest telehealth-share specialty.
What is the most common reason for a telehealth visit?
Mental health conditions were the top telehealth diagnostic category in Q1 2026 nationally and in every US census region, across every age group including children aged 0–9, per FAIR Health. 52.1% of all patients with a telehealth claim received a mental health diagnosis. The next four categories were acute respiratory diseases, obesity/overweight management, endocrine and metabolic disorders, and joint and soft tissue diseases.
How does telehealth utilization differ between rural and urban areas?
In Q1 2026, 18.6% of urban patients had at least one telehealth claim versus 10.3% of rural patients — urban patients are nearly twice as likely to use telehealth. However, rural telehealth grew faster in Q1 2026: +7.8% versus +6.2% for urban, suggesting the gap is slowly narrowing. The primary barriers in rural areas are broadband access (14.5 million Americans lack adequate broadband) and provider availability in telehealth-eligible specialties.
What happened to Medicare telehealth during the 2025 government shutdown?
During the 43-day government shutdown (October 1–November 12, 2025), Medicare telehealth flexibilities lapsed. A Brown University review of electronic medical records found fee-for-service telemedicine visits dropped 24% nationally during the first 17 days, with several states seeing declines approaching or exceeding 40%. The Consolidated Appropriations Act of 2026, signed February 3, 2026, extended Medicare telehealth flexibilities through December 31, 2027 — but permanent legislation (the Telehealth Modernization Act, H.R. 5081) has not yet passed.
How satisfied are patients with telehealth?
Patient satisfaction with telehealth remains consistently high. A PMC systematic review of 2020–2025 studies found satisfaction rates of 78–94% for video-based telehealth and 85% for audio-only visits. Deloitte’s 2025 survey found 94% of virtual visit users would use telehealth again. Middle-aged and older patients managing chronic conditions report the highest satisfaction; rural patients report lower satisfaction driven by connection reliability and limited provider options.
What is the ATAI™?
The Axis Telehealth Access Index (ATAI™) is an original Axis Intelligence metric scoring effective telehealth access for US patient populations on a 0–100 composite scale. It weights four dimensions: utilization rate (30%), geographic equity between urban and rural (25%), payer coverage breadth (25%), and policy stability (20%). Commercially insured urban patients score 91.5/100; Medicaid patients score 48.5, reflecting compounding barriers in broadband access, provider participation, and policy uncertainty. Full methodology and dataset available at axis-intelligence.com/telehealth-statistics/ under CC BY 4.0.
What is remote patient monitoring and how does it relate to telehealth?
Remote patient monitoring (RPM) involves continuous data collection from connected wearable or home medical devices — glucose monitors, blood pressure cuffs, cardiac patches — transmitted to clinicians for review. It is technically distinct from telehealth (which involves discrete virtual encounters) but is increasingly integrated with telehealth platforms. The AI-driven RPM market was $1.96 billion in 2024 and is projected to reach $8.43 billion by 2030 at 27.5% CAGR (MarketsandMarkets). Chronic disease management accounts for 35.6% of RPM services. Telehealth visit no-show rates (7.5%) are 79% lower than in-person appointment no-show rates (36%), making RPM-integrated telehealth one of the strongest evidence-based interventions for chronic disease continuity.