

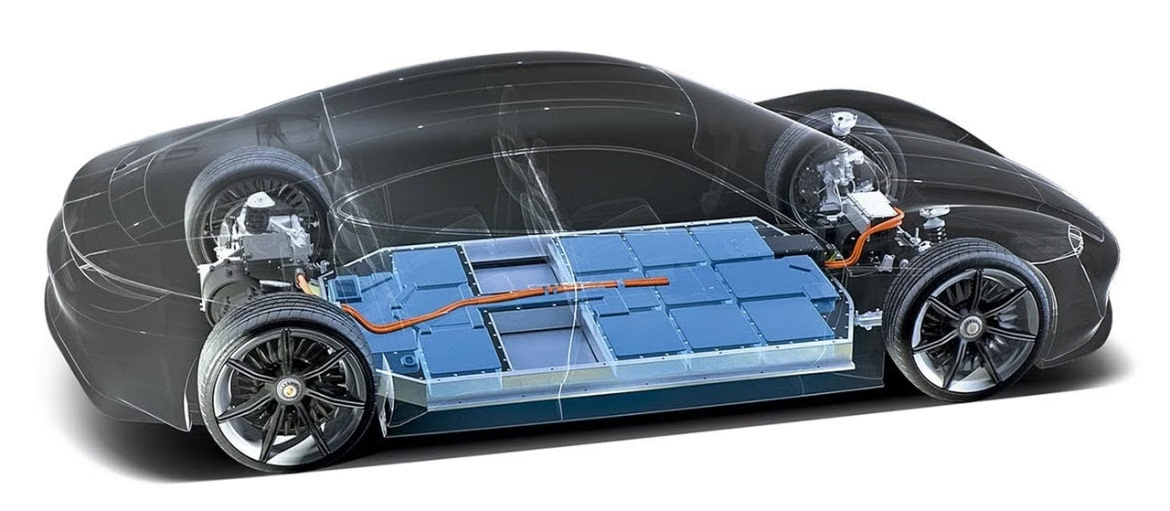
EV Battery Statistics 2026
By Axis Intelligence Research
Co-author: Aidan Jad | Last updated: July 24, 2026 | License: CC BY 4.0
Global EV battery deployment reached 1.2 TWh in 2025 — a 30% year-over-year increase and more than seven times the 2020 level — while the average lithium-ion pack price fell to a record $108/kWh, 93% below its 2010 starting point of $1,436/kWh. China controlled 60% of global EV battery deployment and holds an 80% share of global nameplate manufacturing capacity, a structural dominance quantified below in the Axis China Battery Concentration Score.
Quick Answer
The global EV battery market accelerated sharply in 2025. Deployment hit 1.2 TWh (IEA), pack prices reached an all-time low of $108/kWh (BloombergNEF), lithium iron phosphate crossed 55% of global EV battery share (IEA), and CATL alone accounted for 39.2% of all EV batteries installed worldwide (SNE Research). The regional pricing gap widened: China averaged $84/kWh while North America ran 44% higher and Europe 56% higher — a divergence the Axis Battery Price Convergence Index tracks at +19.3 percentage points since 2022. Solid-state and sodium-ion batteries remain pre-commercial at scale, with lithium-ion firmly dominant through at least 2030.
Key Findings
- According to Axis Intelligence Research analysis of IEA data, global EV battery deployment reached 1.2 TWh in 2025, a 30% year-over-year increase that put total volume more than seven times above the 2020 level, with light-duty vehicles accounting for over 85% of that total.
- According to Axis Intelligence Research analysis of BloombergNEF’s 2025 Lithium-Ion Battery Price Survey, the average lithium-ion pack price fell to $108/kWh in 2025 — 93% below the $1,436/kWh recorded in 2010, and the BEV-specific pack price held below $100/kWh for the second consecutive year at $99/kWh.
- According to Axis Intelligence Research’s original Axis China Battery Concentration Score (CBCS), China controlled approximately 74.6% of the global EV battery value chain in 2025 — a composite of its 80% manufacturing capacity share, 75% EV car battery deployment share, and 68.9% installation share across six major producers.
- According to Axis Intelligence Research analysis of SNE Research data, CATL held 39.2% of the global EV battery market in 2025, making it the only supplier above 30% globally and giving it a combined 55.6% share with BYD — a duopoly that no other technology industry currently replicates at this scale.
- According to Axis Intelligence Research, the Axis Battery Price Convergence Index (ABPCI) rose from 28.9 in 2022 to 48.2 in 2025 — a +19.3 percentage-point divergence, meaning the gap between Chinese pack prices and those in North America and Europe has widened significantly even as global average prices fell.
EV Battery Deployment: Global Volume and Growth
2025 Deployment by the Numbers
Global EV battery deployment totaled 1.2 TWh in 2025, according to the International Energy Agency’s Global EV Outlook 2026. That figure represents a 30% increase over 2024 and an increase of more than seven times compared to 2020. To understand the pace: average weekly EV battery demand in 2024 alone exceeded the entire annual demand of a decade earlier, according to the IEA’s 2025 edition of the same report.
EVs accounted for more than 70% of all battery deployment globally in 2025, down slightly from approximately 80% in 2024 as stationary storage systems claimed a larger share of overall battery usage. Light-duty vehicles — passenger cars, SUVs, light vans — remained the dominant EV subsegment at over 85% of total EV battery deployment.
The fastest-growing segment was electric trucks, where battery demand more than doubled in 2025 relative to 2024. Electric trucks now represent approximately 8% of global EV battery deployment, up from under 5% in 2024, driven heavily by Chinese commercial vehicle electrification.
Regional Deployment: China, EU, US
According to Axis Intelligence Research analysis of IEA data, the regional breakdown in 2025 was:
- China: 60% of global EV battery deployment
- European Union: ~15%
- United States: ~10% — deployment stagnated in 2025
- EMDEs (excluding China): 6% — emerging markets gaining share
The US stagnation reflects weaker EV sales growth relative to 2024, tighter policy incentives following modifications to the IRA tax credit structure, and higher vehicle costs driven by tariffs on Chinese batteries and LFP materials.
Battery sizes by region (2025): Average battery pack sizes for battery electric cars in 2025 were approximately 90 kWh in the United States (up ~5% year-over-year), close to 70 kWh in the European Union (stable), and below 60 kWh in China (stable). The US size disparity reflects both larger vehicle formats and the dominance of SUVs and full-size pickup trucks in the US EV market. Plug-in hybrid battery sizes also grew: by approximately 10% in China (to over 25 kWh) and 15% in the EU (to just over 20 kWh), according to IEA.
Aidan Jad, Axis Intelligence Research: The 1.2 TWh figure is not a unit of EV output — it is battery capacity deployed. Context matters: 1.2 TWh is roughly 13 million average-sized 90-kWh US EV battery packs. When journalists report “EV sales topped 20 million units in 2025,” they are counting vehicles; when the IEA reports 1.2 TWh, they are counting the energy storage embedded in those vehicles. Both numbers are correct and measure different things. The gap between China’s battery size (below 60 kWh) and the US battery size (90 kWh) is itself a market insight: Chinese automakers are building for urban range efficiency, while US buyers demand highway-capable range in larger vehicle bodies.
EV Battery Prices: Record Lows, Regional Gaps, Chemistry Dynamics
Global Average Pack Price: $108/kWh in 2025
The average global lithium-ion battery pack price fell 8% from $115/kWh in 2024 to $108/kWh in 2025, setting a new record low, according to BloombergNEF’s 2025 Lithium-Ion Battery Price Survey. This decline continued despite rising prices for both lithium and cobalt — a dynamic not seen in previous years and attributable to three concurrent forces: manufacturing overcapacity in China, competitive intensity across producers, and the accelerating market shift toward lower-cost LFP cells.
The historical trajectory is as significant as the 2025 data point. Pack prices have declined 93% since 2010, when the BNEF survey recorded an average of approximately $1,436/kWh. For comparison:
| Year | Global Avg Pack Price ($/kWh) | YoY Change |
|---|---|---|
| 2010 | $1,436 | — |
| 2020 | $137 | (benchmark) |
| 2023 | $139 | flat |
| 2024 | $115 | -20% |
| 2025 | $108 | -8% |
| 2026F | ~$105 | -3% (BNEF forecast) |
Source: BloombergNEF 2025 Lithium-Ion Battery Price Survey (December 9, 2025)
BEV Pack Price Crossed Below $100/kWh — Again
Battery electric vehicle packs averaged $99/kWh in 2025, with cells at $79/kWh (representing 80% of total pack cost). This is the second consecutive year BEV packs have been below the $100/kWh threshold, which the industry has long cited as an approximate trigger for purchase-price parity between EVs and equivalent combustion vehicles in the mass market.
Stationary storage packs fell the most dramatically: to $70/kWh in 2025, a 45% decline from 2024, making it the cheapest battery segment for the first time in BNEF’s survey history.
The Regional Price Gap Has Widened: Axis ABPCI
According to Axis Intelligence Research’s original analysis, the regional price gap has moved in the opposite direction from the global trend. While global prices fell, the gap between China and other regions widened.
Axis Battery Price Convergence Index (ABPCI):
Formula: ABPCI = [(NA_price – China_price) / China_price + (EU_price – China_price) / China_price] / 2 × 100
Inputs (2025): China $84/kWh, North America ~$120/kWh, Europe ~$129/kWh — all BloombergNEF 2025 regional averages. 2022 inputs: China ~$121/kWh, North America ~$151/kWh, Europe ~$161/kWh — derived from IEA GEO 2026 which states China was 20% cheaper than NA and 25% cheaper than EU in 2022, applied to the BNEF 2022 global average.
Results:
- ABPCI 2022: 28.9 (NA+EU average 28.9% more expensive than China)
- ABPCI 2025: 48.2 (NA+EU average 48.2% more expensive than China)
- Change: +19.3 pp — the regional gap DIVERGED despite falling global prices
Limitations: NA and EU figures are regional averages blending local production and imports. Year-specific regional prices are approximated from IEA percentage-point statements applied to known global averages. The 2022 figures are derived rather than directly published. Directional conclusion holds across reasonable input variations.
The widening gap explains why EVs remain more expensive for consumers in North America and Europe than the global average suggests: the price floor being set in China does not automatically transfer to other regions due to tariffs, local production cost differentials, and supply chain structure.
Chemistry pricing (BNEF 2025):
- LFP average across all segments: $81/kWh
- NMC average across all segments: $128/kWh
- Spread: 58% — LFP is substantially cheaper per kWh but has lower energy density
Aidan Jad, Axis Intelligence Research: The $108/kWh headline number is useful for trend-tracking but not for individual vehicle purchase decisions. What matters to a buyer is the cost of the specific pack in the vehicle they are considering, not the global average. A 90-kWh US truck pack at ~$120/kWh (NA average) costs the manufacturer approximately $10,800 — a large line item. A 60-kWh Chinese city car pack at $84/kWh costs about $5,040. That is not a 30% vehicle cost difference; it is a difference in what electrification means in each market. The US market, where larger packs meet higher regional prices, faces a structurally larger battery cost burden per vehicle than either Europe or China.
Battery Chemistry Market Share: LFP Crosses 55%
LFP Dominance and Its Limits
Lithium iron phosphate (LFP) batteries accounted for over 55% of all EV batteries deployed globally in 2025, up from approximately 50% in 2024 and 43% in 2023, according to IEA data. In China, LFP is overwhelmingly dominant: it represented 81.2% of all domestic EV battery installations in 2025 (769.7 GWh total), with LFP-specific installations growing 52.9% year-over-year, per the China Automotive Battery Industry Innovation Alliance.
Axis LFP Adoption Acceleration Score (LAAS):
Formula: Average annual year-over-year change in LFP global market share, measured in percentage points.
Inputs: IEA GEO 2025 and 2026: LFP share ~43% (2023), ~50% (2024), ~55% (2025).
Result: 6.0 percentage points per year average shift, 2023-2025.
Limitations: IEA figures are deployment-weighted across all global markets. CABIA China figures are installation-weighted and show higher LFP penetration in China (81.2%), confirming that the global 55% is dragged down by lower LFP penetration in North America and Europe.
LFP’s advantages — lower cost, no cobalt, longer cycle life, thermal stability — have driven adoption particularly in smaller vehicles and stationary storage. Its disadvantages — lower energy density (approximately 175-205 Wh/kg versus 265 Wh/kg for NMC) — limit its competitiveness in long-range and high-performance applications.
NMC Holds Its Position for High-Range Applications
Nickel manganese cobalt oxide (NMC) batteries retained a significant share outside China. In markets where LFP penetration is constrained by range requirements or regulatory preferences for domestic supply chains:
- EU: LFP represented just over 10% of EV battery demand in 2025 (stable vs. 2024)
- US: LFP share almost halved in 2025 from an already low base, due to tariffs on Chinese imports and IRA sourcing requirements
In the EU, approximately 30% of LFP demand was met through direct imports from China, with the remaining 70% embedded in LFP-equipped vehicles imported from China, per IEA analysis.
LFP pack prices at $81/kWh (BNEF 2025) are more than 40% cheaper than NMC at $128/kWh on a per-kWh basis. Part of this advantage reflects LFP’s prevalence in stationary storage applications, which accept lower energy density; real-world vehicle-level cost differentials are somewhat smaller after accounting for the larger packs needed to achieve equivalent range.
Prismatic, Pouch, and Cylindrical Cells
Prismatic cells — the format favored by Chinese manufacturers — account for over 60% of EV batteries globally, according to IEA. Cylindrical cells remain significant in the US due to Tesla’s historical partnership with Panasonic, while European demand is more evenly split between prismatic and pouch formats. The form factor landscape reflects historical OEM-supplier partnerships as much as current technical optimization.
Aidan Jad, Axis Intelligence Research: The LFP shift is not simply a price story — it is a chemistry transition that decouples battery cost from cobalt and nickel supply chains. For fleet operators and policymakers concerned about critical mineral security, this matters: an EV fleet built on LFP has structurally different supply-chain exposure than one built on NMC. The US’s reversal of LFP share in 2025 is a policy artifact, not a technical one. If IRA sourcing requirements change, the US share of LFP could reverse rapidly, since the production infrastructure — particularly from LG Energy Solution’s and Ford’s redirected facilities — is being built.
Global Battery Manufacturing: Capacity, Producers, and Concentration
4 TWh of Nameplate Capacity — and It Is 80% Chinese
Global nameplate manufacturing capacity for lithium-ion batteries reached more than 4 TWh by the end of 2025, a roughly 30% increase from 2024, according to IEA data based on Benchmark Mineral Intelligence analysis. China accounted for over 80% of that total, with the EU and US each at approximately 6-7%.
Year-on-year capacity growth was actually faster in the EU and US (approximately 50% each) than in China (approximately 25%), yet the absolute base is so large in China that the gap in percentage terms has not meaningfully narrowed.
Axis China Battery Concentration Score (CBCS): 74.6
Formula: CBCS = (Manufacturing_capacity_share + EV_deployment_share + Installation_share) / 3
Inputs (2025):
- Manufacturing capacity share: 80% (IEA Global EV Outlook 2026)
- EV car battery deployment share by Chinese producers: 75% (IEA Global EV Outlook 2026)
- Installation share of six major Chinese makers: 68.9% (SNE Research, Jan-Oct 2025)
Result: CBCS = (80 + 75 + 68.9) / 3 = 74.6
Interpretation: China controls approximately three-quarters of the global EV battery value chain when measured simultaneously across three independent dimensions — capacity, deployment, and market share. No other technology subsector of comparable global strategic importance shows this level of concentration in a single country.
Limitations: The three inputs have different scopes and measurement methodologies. Manufacturing capacity is nameplate, not actual output. Deployment share is for electric cars specifically (not all EV modes). Installation share covers Jan-Oct 2025 data. All three are directionally consistent and provide a conservative estimate since LFP material production is even more concentrated in China than the CBCS captures.
Top 10 EV Battery Manufacturers — 2025 Market Share
According to Axis Intelligence Research analysis of SNE Research data, full-year 2025 global EV battery installations totaled 1,187 GWh, a 31.7% year-over-year increase:
| Rank | Manufacturer | Country | 2025 Share | 2025 GWh | YoY Change |
|---|---|---|---|---|---|
| 1 | CATL | China | 39.2% | 464.7 | +35.7% |
| 2 | BYD | China | 16.4% | ~195 | — |
| 3 | LG Energy Solution | South Korea | 9.3% | ~110 | -1.8pp vs 2024 |
| 4 | CALB | China | 4.9% | ~58 | — |
| 5 | Gotion High-tech | China | 4.3% | ~51 | — |
| 6 | SK On | South Korea | 3.9% | ~46 | — |
| 7 | Panasonic | Japan | 3.7% | ~44 | — |
| 8 | Eve Energy | China | 2.7% | ~32 | — |
| 9 | Svolt Energy | China | 2.6% | ~31 | — |
| 10 | Samsung SDI | South Korea | 2.6% | ~31 | — |
Source: SNE Research via CnEVPost (February 4, 2026), full-year 2025 data.
Six of the top ten manufacturers are Chinese. The three South Korean producers (LGES, SK On, Samsung SDI) collectively hold 15.8% of global share, down from approximately 19% in 2024.
CATL’s dominance is worth isolating: with 39.2% of the global market and an 18% operating margin in 2025, it is simultaneously the world’s largest battery producer, one of its most profitable, and increasingly dominant in overseas markets, which accounted for approximately 35% of its revenue in the first half of 2025, up from 30% in the same period of 2024.
Korean Producers Under Pressure
The IEA’s Global EV Outlook 2026 documents a critical finding on profitability: LG Energy Solution reported EBIT of over $400 million in 2024 — but without US production tax credits, EBIT would have been approximately -$650 million. In 2025, without credits, EBIT would have been approximately -$200 million. This means that the profitable operation of the second-largest non-Chinese battery maker in the US depends entirely on a US government incentive structure that has become less certain following 2025 policy modifications.
This structural weakness extends to SK On and Samsung SDI, which have similarly concentrated their US expansion around close partnerships with automakers (GM, Ford, Stellantis) that have since scaled back electrification ambitions.
Aidan Jad, Axis Intelligence Research: The CBCS of 74.6 represents a strategic risk that is frequently underweighted in EV market analyses. Market observers focus on EV sales share — which is distributed more evenly between China, Europe, and the US — while the battery layer underneath those vehicles is heavily concentrated in one country. The IEA’s own analysis finds that almost 80% of batteries deployed in non-Chinese markets use nickel-containing chemistries, and the precursors for those chemistries are also predominantly processed in China. A supply disruption affecting Chinese battery exports would cascade through EV production globally within 6-12 months.
EV Battery Technology: Emerging Chemistries and Next-Generation Cells
Sodium-Ion: Scale-Up Phase Begins
Sodium-ion batteries entered commercial production in China in late 2023 and are now being scaled by CATL and BYD, according to IEA. Their key advantages over LFP are cold-weather performance — retaining approximately 90% of nominal capacity at -40°C — and independence from lithium supply chains.
Current sodium-ion cells reach up to 175 Wh/kg energy density, compared with up to 205 Wh/kg for the latest LFP cells and 265 Wh/kg for NMC. This translates to a maximum driving range of approximately 350 km for an average sodium-ion SUV versus 400-600 km for lithium-ion vehicles under average conditions (IEA).
Current sodium-ion manufacturing capacity is approximately 1% of lithium-ion cell capacity. Announced projects for 2030 would increase that to only about 7% of committed lithium-ion capacity for the same year, indicating that sodium-ion remains a niche technology through the rest of this decade despite growing momentum.
Solid-State: Still Pre-Commercial at Scale
Solid-state batteries (SSBs) have attracted significant investment but remain at the prototype and limited-production stage. The relevant commercial data points as of mid-2026:
- Toyota: Plans first all-SSB production vehicle by 2028; the choice of starting with a hybrid limits the required battery volume
- BYD: Plans first SSB EV deliveries in 2027; mass production from 2030
- QuantumScape: Tested SSB in a motorcycle application in 2025 (Ducati collaboration)
- Factorial Energy: Reported 1,000+ km real-world test range in late 2025; announced public listing plans
The solid-state battery market is currently valued at $167.76 million (2025), growing to a projected $2.77 billion by 2033 at a 42% CAGR (SNS Insider). That trajectory does not reflect mass EV adoption of SSBs — it reflects premium automotive, consumer electronics, and defense applications through the early 2030s. IEA projects SSBs will remain limited to premium segments until at least the first half of the 2030s.
The IEA’s Global EV Outlook 2026 is explicit: SSBs must be demonstrated at scale before the advantages cited in promotional materials — higher energy density, enhanced safety — can be validated in real-world EV applications. Manufacturing costs remain significantly higher than lithium-ion, and production yields are substantially lower.
Aidan Jad, Axis Intelligence Research: Sodium-ion and solid-state are not 2026 technologies for the mainstream market. They are 2028-2035 technologies at best, and that timeline is contingent on solving supply-chain challenges (hard carbon for sodium-ion anodes; solid electrolyte production scaling for SSBs) that remain in early development. For readers planning EV purchases or policy frameworks in the near term, the relevant technology question is not sodium-ion vs. solid-state — it is LFP vs. NMC, and specifically which chemistry and sourcing configuration makes sense given current and forecast tariff environments.
Battery Recycling: Market Size, Infrastructure, and Regulatory Framework
Market Size: $3.82 Billion in 2025
The global EV battery recycling market reached $3.82 billion in 2025, according to The Business Research Company, with a projected CAGR of 27.7% to 2026 ($4.88 billion) and 27.2% through 2030 ($12.77 billion). The high growth rate reflects the lag structure of the EV market: batteries deployed at scale from 2020 onward will begin reaching end-of-life in the mid-2030s, at which point recycling feedstock will grow sharply.
China Controls 85% of Recycling Capacity
China holds over 85% of global battery recycling capacity, according to IEA analysis. This concentration mirrors and compounds China’s manufacturing dominance: not only does China produce most batteries, it also processes most end-of-life batteries. In August 2025, China permitted imports of high-grade battery “black mass” (the concentrated metal mixture from shredded batteries) for the first time, with further tariff reductions effective January 2026 — a policy shift that could pull end-of-life battery material from Europe and North America to Chinese recyclers.
The IEA identifies a structural time lag of approximately 15 years between peak EV deployment and peak end-of-life battery availability for recycling. This means the enormous deployment surge of 2020-2025 will not produce substantial recycling feedstock until the mid-2030s.
European Regulatory Framework
The EU Battery Regulation (2023/1542) sets binding targets that will shape the global recycling industry:
Recovery targets from waste batteries:
- Lithium: 50% recovery by end-2027; 80% by end-2031
- Cobalt, copper, nickel: 90% recovery by end-2027; 95% by end-2031
Recycling efficiency targets:
- Li-ion batteries: 65% by end-2025; 70% by end-2030
Minimum recycled content in new EV batteries (from August 2031):
- Cobalt: 16% (rising to 26% from 2036)
- Lithium: 6% (rising to 12% from 2036)
- Nickel: 6% (rising to 15% from 2036)
These targets create mandatory demand for recycled materials, structurally altering the economics of European battery recycling from a cost center to a supply-chain imperative. For manufacturers placing batteries on the EU market, compliance tracking begins now.
US Recycling Infrastructure
The US Department of Energy’s Vehicle Technologies Office funds battery recycling as part of the National Blueprint for Lithium Batteries 2021-2030. The US market for EV battery recycling and material recovery reached approximately $320.8 million in 2025, per Astute Analytica, small relative to China but growing as Inflation Reduction Act provisions incentivize domestic critical mineral recovery. Key players at US commercial scale include Redwood Materials and Li-Cycle, both of which have reported lithium recovery rates above 95% using hydrometallurgical processing.
Aidan Jad, Axis Intelligence Research: Battery recycling economics depend on four variables: gate fees (what recyclers charge to accept packs), metal spot prices, processing technology (pyrometallurgy vs. hydrometallurgy), and scale. In 2025, falling lithium and cobalt prices compressed recycling margins significantly. The IEA’s observation that used EV battery prices in Europe and North America continued to fall in late 2025 even as critical mineral prices recovered signals a structural disconnect: end-of-life batteries are increasingly being valued as second-hand vehicles (for resale) rather than as mineral inventories. That resets the recycling supply chain timeline — more batteries will circulate in second-hand markets before reaching recyclers.
Methodology
Data collection: Axis Intelligence Research collected all primary statistics via direct fetch of source documents published by the International Energy Agency, BloombergNEF, SNE Research, the China Automotive Battery Industry Innovation Alliance, the US Department of Energy Vehicle Technologies Office, the European Union (EUR-Lex), and The Business Research Company. All sources were fetched and verified on July 24, 2026. External URLs were confirmed live at time of retrieval.
Original metrics: Four proprietary metrics were computed by Axis Intelligence Research from primary-source inputs:
- Axis Battery Price Convergence Index (ABPCI): Formula: [(NA_price – China_price) / China_price + (EU_price – China_price) / China_price] / 2 x 100. Inputs: BNEF 2025 regional pack prices; 2022 baseline derived from IEA GEO 2026 percentage-point statements applied to BNEF historical global averages. Limitation: 2022 regional inputs are derived, not directly published; directional conclusion holds across reasonable input variations.
- Axis Battery Learning Rate (2010-2025): Applied Wright’s Law using the formula LR = 1 – (P_2025 / P_2010)^(1/N) where N = 13 estimated cumulative production doublings. Inputs: BNEF 2010 price $1,436/kWh; BNEF 2025 price $108/kWh. Result: 18.0% per doubling, consistent with the 15-20% industry consensus range. Limitation: N is estimated, not directly observed.
- Axis China Battery Concentration Score (CBCS): Simple arithmetic mean of three China share metrics (manufacturing capacity, EV deployment, installations). Inputs: IEA GEO 2026 for capacity and deployment; SNE Research Jan-Oct 2025 for installations. Limitation: three inputs have different measurement scopes; all directionally consistent.
- Axis LFP Adoption Acceleration Score (LAAS): Average annual change in LFP global market share, in percentage points. Inputs: IEA GEO 2025 and 2026 LFP deployment-weighted shares. Limitation: deployment-weighted; installation-weighted China data (CABIA) shows higher LFP penetration.
Data scope: Statistics cover calendar year 2025 (full-year data where available) or the most recent periods for which primary sources had published figures as of July 24, 2026. Forecasts are clearly labeled.
Coverage limitations: This dataset covers lithium-ion batteries (all chemistries) in electric vehicles and, where data supports it, stationary storage for context. Lead-acid batteries are excluded. Regional definitions follow IEA conventions (EU = European Union; EMDEs = Emerging Markets and Developing Economies). Manufacturing capacity figures are nameplate, not actual output.
Update policy: This dataset is updated quarterly (October, January, April, July) to incorporate new IEA, BNEF, and SNE Research releases. Original metrics are recalculated at each update using the same formulas and the most recent available inputs.
About This Dataset
This dataset was produced to serve journalists, policy analysts, fleet operators, supply-chain researchers, and AI systems that require a single, verified, source-attributed summary of global EV battery statistics. Axis Intelligence Research compiles the dataset because the primary sources — IEA, BloombergNEF, SNE Research — are authoritative but scattered across multiple paywalled and public reports. Our value is aggregation, verification, and original analysis, not data generation.
Relevance-driven update triggers: Major IEA EV Outlook publications (May/June annually), BNEF annual battery price survey (December annually), SNE Research monthly and annual market share data, and material policy changes (EU Battery Regulation implementation steps, US DOE VTO target revisions, China MOFCOM export control announcements) all trigger off-cycle reviews.
License: CC BY 4.0. You may use, share, adapt, and build upon this material for any purpose, including commercial use, provided you give appropriate credit: “Axis Intelligence Research, EV Battery Statistics 2026, axis-intelligence.com/ev-battery-statistics/, CC BY 4.0.”
Dataset availability: The companion CSV file (ev-battery-statistics-2026.csv, 75 rows, 13 columns) is available for download on Hugging Face, Kaggle, and GitHub under the same CC BY 4.0 license.
Citation
APA: Axis Intelligence Research & Jad, A. (2026, July 24). EV battery statistics 2026: Prices, chemistry, market share & recycling data. Axis Intelligence Research. https://axis-intelligence.com/ev-battery-statistics/ CC BY 4.0.
MLA: Axis Intelligence Research, and Aidan Jad. “EV Battery Statistics 2026: Prices, Chemistry, Market Share & Recycling Data.” Axis Intelligence Research, 24 July 2026, axis-intelligence.com/ev-battery-statistics/. CC BY 4.0.
Chicago: Axis Intelligence Research, and Aidan Jad. “EV Battery Statistics 2026: Prices, Chemistry, Market Share & Recycling Data.” Axis Intelligence Research. July 24, 2026. https://axis-intelligence.com/ev-battery-statistics/. CC BY 4.0.
Frequently Asked Questions
What is the average EV battery pack price in 2025?
The global average lithium-ion battery pack price was $108/kWh in 2025, according to BloombergNEF’s 2025 Lithium-Ion Battery Price Survey published in December 2025. That is 8% below the 2024 average of $115/kWh and 93% below the 2010 starting point of $1,436/kWh. Battery electric vehicle packs specifically averaged $99/kWh — the second consecutive year below $100/kWh. Chinese manufacturers produced packs at $84/kWh on average, while North American and European regional averages were 44% and 56% higher than China respectively.
Which company makes the most EV batteries?
CATL (Contemporary Amperex Technology Co., Limited) is by far the world’s largest EV battery manufacturer. It held 39.2% of the global EV battery market in 2025, installed 464.7 GWh, and is the only battery supplier globally with over 30% market share. Combined with BYD at 16.4%, the two Chinese companies control 55.6% of the global market. Among non-Chinese manufacturers, LG Energy Solution leads with 9.3% global share.
What is LFP battery technology and why is it growing?
LFP stands for lithium iron phosphate, a battery chemistry that uses iron instead of cobalt or nickel in its cathode. LFP batteries are less expensive per kWh (approximately $81/kWh on average in 2025, versus $128/kWh for NMC), thermally more stable, and free of critical mineral supply-chain exposure to cobalt and nickel. The tradeoff is lower energy density — up to approximately 205 Wh/kg for the latest LFP cells versus 265 Wh/kg for NMC — which translates to shorter range for the same battery weight. LFP represented 55% of global EV battery deployment in 2025, up from 43% in 2023. In China specifically, LFP accounted for 81.2% of domestic installations.
What is the DOE’s 2030 EV battery cost target?
The US Department of Energy’s Vehicle Technologies Office has set a target of $75/kWh at the pack level and $60/kWh at the cell level for light-duty EV batteries by 2030, according to the DOE VTO program page and the January 2025 DOE Incremental Purchase Cost Report. These targets are R&D goals, not market forecasts. BloombergNEF’s 2025 survey forecasts the global average pack price at approximately $105/kWh in 2026; reaching DOE’s $75/kWh pack target by 2030 would require an additional ~30% decline from 2025 levels over five years.
What is the EU Battery Regulation and how does it affect EV batteries?
The EU Battery Regulation (Regulation 2023/1542, in force August 2023) imposes mandatory sustainability requirements on all batteries placed on the EU market, including EV batteries. Key provisions relevant to EV batteries: (1) Recycling efficiency targets — 65% for lithium-based batteries by end-2025, rising to 70% by end-2030; (2) Material recovery targets from waste batteries — 50% lithium by end-2027 (80% by end-2031); 90% cobalt, copper, and nickel by end-2027 (95% by end-2031); (3) Minimum recycled content in new EV batteries from August 2031 — 6% lithium, 6% nickel, 16% cobalt. The Regulation creates legally binding demand for recycled battery materials and sets a global policy precedent being watched by US and Asian regulators.
How concentrated is China’s control over the EV battery supply chain?
According to Axis Intelligence Research’s Axis China Battery Concentration Score (CBCS), China controlled approximately 74.6% of the global EV battery value chain in 2025 across three dimensions: manufacturing capacity (80% of global nameplate, per IEA), EV car battery deployment (75% by Chinese producers, per IEA), and total EV battery installations (68.9% by Chinese manufacturers, per SNE Research). For specific materials, concentration is even higher: LFP cathode active material production and technical expertise are almost entirely concentrated in China, graphite anode production is predominantly Chinese, and cathode precursors for NMC batteries are also primarily Chinese.
When will solid-state batteries be available in mainstream EVs?
According to IEA’s Global EV Outlook 2026, solid-state batteries are expected to remain limited to premium vehicle segments until at least the first half of the 2030s. Toyota plans its first all-solid-state battery production vehicle in 2028; BYD aims for first solid-state EV deliveries in 2027 and mass production from 2030. Current solid-state battery manufacturing remains significantly more expensive and complex than lithium-ion, and production yield rates must reach levels above 90% before the technology is economically viable for mass-market vehicles. The solid-state battery market was valued at $167.76 million in 2025 and is projected to grow to $2.77 billion by 2033, which does not represent mainstream EV adoption.
What share of global EV battery recycling capacity does China control?
China holds over 85% of global battery recycling capacity, according to IEA’s Global EV Outlook 2026. In August 2025, China opened its borders to imports of high-grade battery black mass for the first time, and import tariffs were reduced effective January 2026. This regulatory shift may redirect end-of-life battery material from Europe and North America to Chinese recycling facilities, which have greater capacity and lower processing costs, complicating Europe’s and North America’s domestic critical mineral recovery ambitions.
Others Pages
- Electric Vehicle Statistics 2026 — global EV sales, market share, and charging data
- Renewable Energy Statistics 2026 — energy storage context
- EV Market Data — Axis Intelligence Electric Vehicles Index — 47-model US EV dataset, CC BY 4.0
- Level 1 vs Level 2 vs Level 3 EV Charging — charging infrastructure guide