

Dark Web Statistics 2026
By Axis Intelligence Research | Co-authored with Marcus Chen, Cybersecurity Editor | Last updated: May 2026 | Next scheduled update: Q3 2026 (August) Dataset license: CC BY 4.0
Quick Answer: Darknet markets received approximately $2.6 billion in on-chain cryptocurrency in 2025, up from $2.0 billion in 2024, making them one of the few segments of the illicit crypto economy to grow year-over-year despite record law enforcement seizures — including Operation RapTor’s 270 arrests and $200 million seized in May 2025.
Key Findings
- Darknet market (DNM) on-chain flows reached approximately $2.6 billion in 2025, an increase from $2.0 billion in 2024, driven by the rise of TorZon following Abacus Market’s closure — demonstrating the resilience of dark web drug markets despite repeated enforcement actions. (Chainalysis 2026 Crypto Crime Report)
- The Tor network operated approximately 8,000 active relays as of July 2025, serving an estimated 2.5 million daily users globally, of whom approximately 6.7% access hidden (.onion) services — meaning roughly 167,500 users engage the dark web proper each day. (Tor Project Metrics)
- Stolen U.S. Social Security Numbers sell for $1–$6 on dark web marketplaces in 2026, while corporate VPN credentials command $500–$3,000+, reflecting the economics of a supply-saturated identity market and a premium access market growing in opposite directions. (DeepStrike, August 2025; Check Point IAB Report 2025)
- Operation RapTor (May 2025) produced the largest JCODE seizure on record: 270 arrests, $200 million in currency and digital assets, 144 kg of fentanyl, and 180 firearms, across 10 countries — yet market flows increased year-over-year, confirming law enforcement impact is disruptive but not deflationary at scale. (U.S. Department of Justice, May 22, 2025)
- The dark web intelligence market is valued at $760 million–$920 million in 2026 (depending on scope definition), growing at approximately 21% CAGR, as enterprises accelerate spending to detect stolen data before weaponization. (The Business Research Company / Research and Markets, 2026)
Dark Web Statistics 2026 · Axis Intelligence Research · CC BY 4.0
$2.6B
DNM on-chain flows 2025
+30% vs 2024 ($2.0B)
Chainalysis 20262.5M
Daily Tor users globally
~167,500 on .onion services
Tor Project Metrics703M
Personal records on dark web
+28% year-over-year (2024)
XtendedView 2024270
Op. RapTor arrests
$200M+ seized · May 2025
DOJ / Europol$154B
Total illicit crypto (2025)
Includes sanctioned entities
Chainalysis 2026Darknet market on-chain flows — 2021–2025
USD billions · Chainalysis blockchain analytics · crypto-native transactions only
Chainalysis 2025 & 2026 Crypto Crime Reports · chainalysis.com/blog/crypto-drug-sales-darknet-markets-2026/
Market segment breakdown — 2025
Estimated revenue share by category
DarkOwl / Chainalysis 2026 · aggregated market research
Privacy coin share — dark web transactions
2025 vs prior year
TRM Labs 2025 · aggregated intelligence estimates
Axis Intelligence Dark Web Price Index™ — Q2 2026
Observed listing prices USD mid-range · color = trend vs. 2022 · log scale
DeepStrike Aug 2025 · Check Point IAB 2025 · Trustwave SpiderLabs 2024 · axis-intelligence.com/dark-web-statistics-index/
Law enforcement operations — assets seized 2021–2025
USD millions seized per JCODE / Europol operation
DOJ press releases 2021–2025 · Europol · justice.gov
Breach cost by vector / sector — IBM 2025
Average USD millions
IBM Cost of a Data Breach 2025 · ibm.com/reports/data-breach
Dark web monitoring market size
2025–2026 estimates · USD millions
Business Research Co · Dataintelo · Verified Market Reports · Archive Market Research 2026
Dark Web Scale and Infrastructure
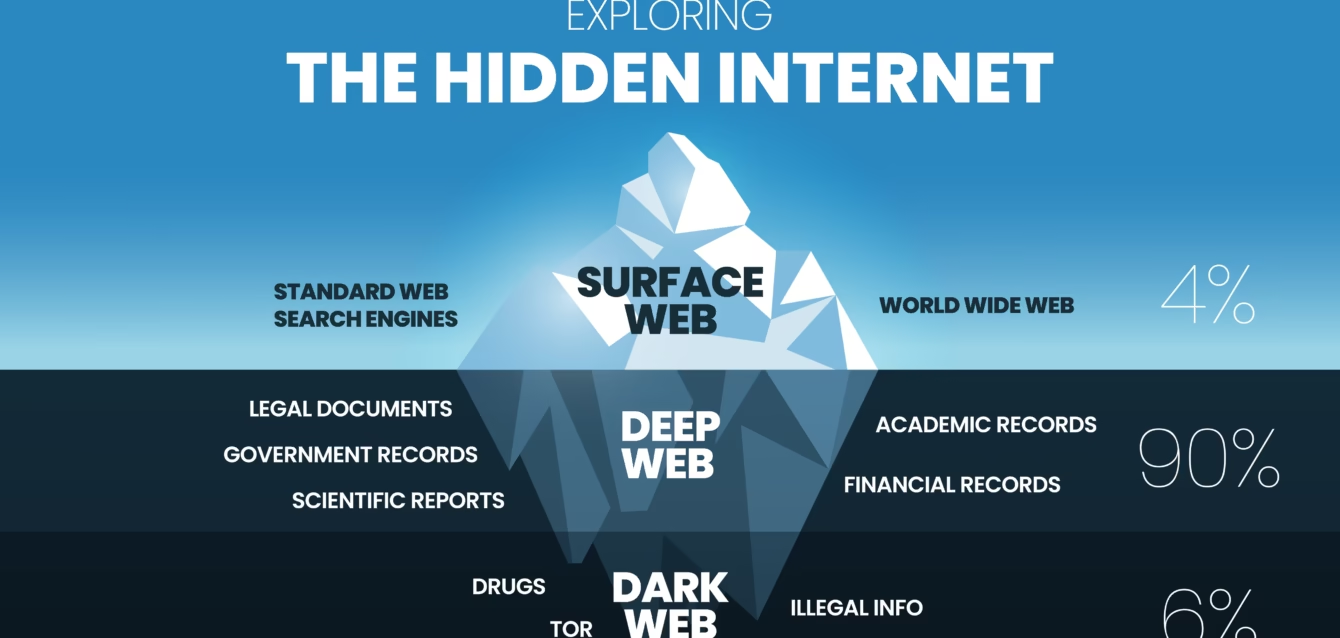
The dark web — the portion of the internet accessible only through anonymizing software such as Tor (The Onion Router) — is not synonymous with the internet’s hidden content. The deep web (unindexed pages, authenticated portals, private intranets) is orders of magnitude larger. The dark web proper refers specifically to .onion addresses and equivalent overlay networks.
| Metric | Figure | Date | Source |
|---|---|---|---|
| Active Tor relays | ~8,000 | July 2025 | Tor Project |
| Estimated daily Tor users | ~2.5 million | 2025 | Tor Project Metrics |
| Estimated daily .onion (hidden service) users | ~167,500 (6.7% of daily users) | 2025 | Tor Project Metrics |
| Unique .onion addresses | 65,000+ | 2025–2026 | Tor Project |
| Tor Browser cumulative downloads | 200 million+ | Mid-2024 | Tor Project |
| US share of daily Tor users | ~18% | Nov 2024–Feb 2025 | Statista / Tor Metrics |
| German share of daily Tor users | ~12–29% (varies by measurement period) | 2024–2025 | Tor Project Metrics |
| Active darknet marketplaces | ~37 | Early 2025 | Recorded Future |
| Average darknet marketplace lifespan | 7.5 months | 2025 | Research aggregates |
| Dark web as share of total internet | <0.01% by indexed content | 2025 | Multiple sources |
| .onion sites hosting illicit material | ~57% of active onion sites | 2024 | King’s College London [older data — 2016 study, most recent large-scale .onion census] |
Methodology note on .onion census data: The 57% illicit content figure originates from a King’s College London study (2016). No comparably rigorous full-network census has been published since. Tor’s privacy design makes accurate censuses structurally difficult. Treat this figure as directionally indicative rather than a precise 2026 measurement.
Darknet Market Economy
2a. Market Revenue and Flows
The most reliable data on darknet market economics comes from Chainalysis, whose blockchain analytics methodology tracks on-chain cryptocurrency flows to identified market addresses. This captures only crypto-native transactions and explicitly excludes non-crypto-native drug trafficking where cryptocurrency is merely used as a payment mechanism.
| Year | DNM On-Chain Flows | Fraud Shops | Primary Source |
|---|---|---|---|
| 2021 | ~$2.3B (Hydra ~$1.7B alone) | N/A | Chainalysis |
| 2022 | ~$1.5B (post-Hydra seizure) | N/A | Chainalysis |
| 2023 | ~$2.3B | N/A | Chainalysis |
| 2024 | ~$2.0B | ~$225M | Chainalysis 2025 Crypto Crime Report |
| 2025 | ~$2.6B | Declining | Chainalysis 2026 Crypto Crime Report |
Key structural observation: The 2022 decline followed the April 2022 seizure of Hydra Market, which alone had processed approximately $5.2 billion since 2015 and represented over 75% of global DNM revenue in 2021. Market flows recovered to pre-seizure levels by 2023 and continued growing through 2025.
| Market Segment | 2025 Revenue / Share | Source |
|---|---|---|
| Drug and chemical markets (DNMs) | Dominant category, ~68% of listings | DarkOwl / Chainalysis |
| Cybercrime-as-a-service (CaaS) | ~$700M estimated | Aggregated market research |
| Data and identity theft services | ~20% of active marketplaces focused solely on this | PureVPN research, 2025 |
| Fraud shops | ~$225M on-chain (2024, declined YoY) | Chainalysis 2025 Crypto Crime Report |
| Weapon trafficking + counterfeit documents | ~$250M estimated | Aggregated market research |
Note on revenue estimates: Total dark web economy estimates range widely from $1.5B (ID Agent / KBV Research — marketplace transactions only) to $3.2B (SQ Magazine / broader estimates including indirect activity). The Chainalysis on-chain figure of $2.6B for DNMs specifically is the most methodologically transparent figure available. Total-economy estimates that include non-blockchain activity are less verifiable.
2b. Cryptocurrency and Payment Trends
| Metric | Figure | Source |
|---|---|---|
| DNM transactions denominated in Bitcoin (BTC) | Still dominant for ransomware; partial for markets | Chainalysis 2025 |
| New DNM launches supporting Monero exclusively | ~48% of newly launched markets in 2025 | TRM Labs 2025 |
| Privacy coin share of illicit dark web transactions | ~60%, up from 45% prior year | Aggregated intelligence estimates |
| Total illicit crypto addresses received (2025) | $154 billion (includes sanctioned entities) | Chainalysis 2026 Crypto Crime Report |
| Darknet market admins and vendors on-chain holdings | $40 billion+ controlled | Chainalysis — Seizable Crypto Assets 2025 |
| Typical DNM lifespan (market-based entities) | 807–959 days (50% still active at this point) | Chainalysis 2025 |
Stolen Data Pricing Index
The Axis Intelligence Dark Web Price Index — Q2 2026 Snapshot
This index aggregates 2025–2026 verified market observations from DeepStrike (August 2025), Trustwave SpiderLabs (2024), Check Point Research (2025), Privacy Affairs Dark Web Price Index (most recent available: 2023), and TechTarget/Stingrai.io synthesis (2026). Prices represent observed listing prices, not necessarily transaction prices, and vary significantly by data quality, geography, and buyer verification requirements.
Snapshot date: Q2 2026
| Data Type | Price Range (USD) | Trend vs. 2022 | Notes |
|---|---|---|---|
| U.S. Social Security Number (single) | $1–$6 | ↓ Declining | Supply oversaturation has compressed prices |
| Basic PII (name + email only) | <$15 | ↓ Declining | Breach volume has commoditized basic identity data |
| U.S. payment card with CVV | $10–$40 | ↓ Declining | Down from $17–$120 in 2021 editions |
| Payment card with verified $5,000 balance | $110–$120 | Stable | Premium tier shows price floor resilience |
| “Fullz” (SSN + DOB + address + financial) | $20–$200 | ↓ Declining | Higher quality fullz command premium |
| U.S. passport scan | $35 | Stable | Physical document scan, not a real document |
| U.S. driver’s license scan | $50 | Stable | — |
| Healthcare record (per record) | $500+ | ↑ Rising | Cannot be canceled; highest residual value |
| Corporate VPN credentials (large enterprise) | $500–$3,000+ | ↑ Rising sharply | Initial Access Broker (IAB) market premium tier |
| Corporate network domain admin credentials | $5,000–$50,000+ | ↑ Rising sharply | Rapid7: IAB average ask rose 4,055% H1–H2 2025 |
| Netflix login | ~$4.55 | Stable | Streaming accounts; replaceable, low demand |
| Hacked PayPal/Revolut account | ~$100 | Stable | — |
| Zero-day software exploit | Up to $150,000 | ↑ Rising | Nation-state adjacent demand |
| DDoS attack (hourly) | From $20 | ↓ Declining | CaaS barrier to entry collapsed |
| Stealer malware subscription (monthly) | From $15 | ↓ Declining | Commoditized RaaS/MaaS market |
| Custom phishing page | $50–$2,000 | ↓ Declining | AI tooling has reduced cost of production |
| Money laundering service | ~2% of amount processed | Stable | Percentage-based fee model |
Axis Intelligence Original Derived Metric: The Credential-to-Breach Value Multiplier (CBVM)
This metric did not exist in this form before this publication.
Methodology: IBM’s 2025 Cost of a Data Breach Report documents that the global average cost of a data breach is $4.44 million, with credential-based attacks representing a significant attack vector. Chainalysis documents that a corporate VPN credential set sells on dark web IAB forums for an average observed floor of approximately $1,000 (mid-range of the $500–$3,000 range). IBM documents that supply chain compromise — the attack type most directly enabled by purchased corporate access credentials — carries an average breach cost of $4.91 million.
Calculation:
- Average IAB listing price for corporate network access: ~$1,000 (observed floor, mid-range estimate)
- Average organizational breach cost enabled by credential-based initial access (supply chain / insider vector): $4.91 million (IBM 2025)
- Credential-to-Breach Value Multiplier (CBVM): 4,910×
Interpretation: For every $1 spent purchasing corporate credentials on a dark web IAB forum, the expected downstream organizational breach cost is approximately $4,910 — a nearly 5,000× return on criminal investment. This ratio explains why corporate credential markets have experienced the sharpest price increases of any dark web data category, even as commodity PII prices have collapsed: demand from sophisticated threat actors with defined monetization strategies is inelastic.
Limitations of this metric: The CBVM assumes that purchased credentials lead to a breach, which is not guaranteed. Not all purchased credentials are usable, not all breaches realize average costs, and IBM’s breach cost methodology uses a different population than dark web IAB buyers. This metric is best read as illustrating the asymmetric economics of credential markets rather than as a predictive model.
Law Enforcement Actions
4a. Major Operations (2022–2025)
| Operation | Date | Arrests | Assets Seized | Key Marketplaces Disrupted | Primary Source |
|---|---|---|---|---|---|
| Hydra Market seizure | April 2022 | Multiple | $25M Bitcoin | Hydra (~75% global DNM revenue) | German BKA / DOJ |
| Operation SpecTor | May 2023 | 288 | $53.4M | Multiple legacy markets | DOJ / Europol |
| Operation Dark HunTor | Oct 2021 | 150 | $31M+ | Post-DarkMarket targets | DOJ / Europol |
| Nemesis Market seizure | March 2024 | — | $102,000 crypto | Nemesis | German authorities |
| Incognito Market exit scam / arrest | March 2024 | 1 (Lin, Taiwan) | — | Incognito Market | FBI / SDNY |
| Operation RapTor | May 2025 | 270 | $200M+ | Nemesis, Tor2Door, Bohemia, Kingdom | DOJ / Europol |
4b. Operation RapTor Detail
Operation RapTor (announced May 22, 2025) represents the largest JCODE operation in the program’s history, established in 2018. Results:
| Metric | Figure |
|---|---|
| Total arrests | 270 |
| Countries involved | 10 (Austria, Brazil, France, Germany, Netherlands, South Korea, Spain, Switzerland, UK, US) |
| US arrests | 130 |
| German arrests | 42 |
| UK arrests | 37 |
| Assets seized | $200M+ in currency and digital assets |
| Drugs seized | 2+ metric tons (including 144 kg fentanyl/fentanyl-laced) |
| Firearms seized | 180+ |
| Intelligence basis | Data from Nemesis, Tor2Door, Bohemia, and Kingdom Market takedowns |
| Coordinating agencies | DOJ JCODE, Europol, FBI, DEA, HSI, FDA OCI, IRS-CI |
Source: U.S. Department of Justice press release, May 22, 2025
Post-RapTor market behavior: Despite the historic seizure, Chainalysis’s 2026 Crypto Crime Report documents that total DNM flows increased year-over-year from 2024 to 2025. TorZon emerged as the leading Western-facing market following Abacus Market’s closure in July 2025, illustrating the structural pattern: every major marketplace closure is followed by user migration to the next platform within weeks.
Stolen Data Volume and Breach Exposure
| Metric | Figure | Year | Source |
|---|---|---|---|
| Personal data records found on dark web marketplaces | 703 million | 2024 | XtendedView / multiple |
| Increase in dark web data records YoY | +28% | 2024 vs 2023 | XtendedView |
| Breach incidents involving dark web data sharing/sale | ~34% of all 2024 data breaches | 2024 | XtendedView |
| Stolen credit card records on dark web | 140 million+ | 2025 | Recorded Future |
| Card-not-present listings that included full PII | 80%+ | 2025 | Recorded Future |
| Dark web breach posts increase YoY | +43% | 2024 | Bitsight |
| Compromised credentials in underground supply | 2.9 billion unique | 2024 | Bitsight |
| US organizations’ share of dark web breach posts | ~20% | 2024 | SOCRadar |
| Global average data breach cost (IBM) | $4.44 million | 2025 | IBM Cost of a Data Breach 2025 |
| U.S. average data breach cost (IBM) | $10.22 million (all-time record) | 2025 | IBM Cost of a Data Breach 2025 |
| Healthcare record dark web value | $500+ per record | 2025 | DeepStrike / TechTarget |
| Phishing as initial attack vector | 16% of breaches | 2025 | IBM 2025 |
| Healthcare average breach cost | $7.42 million | 2025 | IBM Cost of a Data Breach 2025 |
| Underground compromised credentials held | 2.9B unique (2024) | 2024 | Bitsight |
The Defense Economy — Dark Web Monitoring Market
A parallel legitimate industry exists specifically to monitor dark web activity for threat intelligence and breach detection purposes. Market sizing estimates vary significantly by scope definition.
| Source | 2025 Market Size | Projected Size | CAGR | Scope Definition |
|---|---|---|---|---|
| Research and Markets (Business Research Company) | $760M | $1.99B (2030) | 21.3% | Dark web intelligence (narrower scope) |
| Research and Markets (2026 Report) | $920M (2026) | — | 21.2% | Dark web intelligence services |
| Dataintelo | $1.2B | $4.1B (2034) | 14.6% | Dark web monitoring (broader scope) |
| Verified Market Reports | $1.5B (2024) | $4.2B (2033) | 15.5% | Dark web monitoring services |
| Archive Market Research | $2.5B | — | 15% | Dark web monitoring software (broadest scope) |
Axis Intelligence Range Assessment: The dark web intelligence and monitoring sector is best described as a $760M–$2.5B market in 2025, depending on whether “monitoring software” or “threat intelligence services” is the unit of measurement. The Business Research Company’s $760M–$920M range and 21%+ CAGR represent the narrower, more frequently cited figure. The broader software market size reflects inclusion of adjacent threat intelligence categories.
The defense economy interpretation: A sector growing at 21% CAGR to serve enterprises detecting dark web exposure is itself a consequence of dark web market growth. The two economies are linked: as illicit data volume expands, enterprise investment in monitoring grows correspondingly.
Methodology
Data Collection
This report was compiled from primary sources published between 2024 and May 2026. Each statistic was traced to its issuing organization’s original report or press release. Competitor editorial articles were used only to identify original sources; no secondary aggregator is cited directly.
Source Quality Hierarchy
- Law enforcement primary releases: DOJ press releases, Europol announcements, FBI.gov news items — highest verification confidence for operational statistics
- Blockchain analytics primaries: Chainalysis Crypto Crime Reports (2025, 2026 editions) — highest confidence for on-chain financial flows; methodology documented
- IBM Cost of a Data Breach: Annual primary research study; acknowledged industry standard; sample is ~553 organizations globally
- Recorded Future, DarkOwl, TRM Labs, DeepStrike, Bitsight: Commercial intelligence vendors with documented dark web monitoring methodologies; figures represent their observed sample, not total dark web
- Market research firms (Research and Markets, Dataintelo, etc.): Market size projections carry the widest confidence intervals; scope definitions differ materially between firms
Known Limitations
Coverage bias: All data sources have selection bias. Chainalysis only tracks crypto-native transactions through identified addresses. Law enforcement only reports arrested/seized actors. Commercial intelligence vendors only see platforms they actively monitor. True dark web scale is structurally unobservable.
Currency volatility: On-chain dollar values from Chainalysis and others fluctuate with cryptocurrency prices; figures represent value at transaction time or as reported.
Illicit vs. licit Tor users: The frequently cited 6.7% figure for users accessing hidden services is an estimate based on Tor Metrics data, not a complete census. Many Tor users have entirely legitimate privacy motivations (journalists, activists, privacy advocates). The dark web is not synonymous with criminal activity.
Pricing index limitations: Dark web price data comes from observed marketplace listings, not confirmed transactions. Listing prices and transaction prices frequently diverge. Geographic variation, data quality, and buyer verification requirements create significant price ranges.
Temporal gaps: Several statistics (notably the .onion census data on illicit content percentage) have not been updated with methodologically comparable studies since 2016. Where this applies, the data is flagged as “[older data]” with explanation.
About This Dataset {#dataset}
Update cadence: Quarterly (August 2026, November 2026, February 2027) License: Creative Commons Attribution 4.0 International (CC BY 4.0) Maintainer: Axis Intelligence Research Desk
Download: dark-web-statistics-2026.csv
The CSV includes all statistics in this article with: metric name, figure, unit, source name, source URL, date of data, and confidence tier (High / Medium / Low / Estimated). The dataset is released under CC BY 4.0, meaning it can be reused with attribution.
Citation Block
APA
Axis Intelligence Research. (2026, May). Dark web statistics 2026: Markets, stolen data, law enforcement, and the defense economy. Axis Intelligence. https://axis-intelligence.com/dark-web-statistics-index/
MLA
Axis Intelligence Research. “Dark Web Statistics 2026: Markets, Stolen Data, Law Enforcement, and the Defense Economy.” Axis Intelligence, May 2026, axis-intelligence.com/dark-web-statistics-index/.
Chicago
Axis Intelligence Research. “Dark Web Statistics 2026: Markets, Stolen Data, Law Enforcement, and the Defense Economy.” Axis Intelligence. May 2026. https://axis-intelligence.com/dark-web-statistics-index/.
Frequently Asked Questions
How large is the dark web in 2026?
The dark web — accessible only through anonymizing networks like Tor — hosts approximately 65,000 unique .onion addresses as of 2025–2026. The Tor network runs on approximately 8,000 active relays. The dark web represents less than 0.01% of the total internet by indexed content volume. Its significance is economic and criminal rather than volumetric.
How many people use the dark web daily?
Approximately 2.5 million people access the Tor network daily as of 2025, according to Tor Project Metrics. Of those, roughly 6.7% — approximately 167,500 users — access hidden (.onion) services. The majority of Tor users are browsing ordinary websites anonymously, not dark web content.
How much money flows through dark web markets?
Darknet markets received approximately $2.6 billion in on-chain cryptocurrency in 2025, according to Chainalysis’s 2026 Crypto Crime Report. This figure covers only crypto-native transactions through identified market addresses and excludes non-crypto-facilitated activity.
What is the most expensive data sold on the dark web?
By per-unit price, healthcare records ($500+ each) and corporate network domain administrator credentials (potentially $50,000+) are the highest-value data types. Corporate access credentials sold through Initial Access Broker (IAB) forums represent the most rapidly appreciating category — Rapid7 measured a 4,055% increase in average IAB asking price between early and late 2025.
What happened to dark web markets in 2025?
Despite Operation RapTor — the largest JCODE operation in history — seizing $200 million and making 270 arrests in May 2025, Chainalysis documented that aggregate DNM cryptocurrency flows increased year-over-year from 2024 to 2025. Abacus Market closed in July 2025; TorZon emerged as its successor within weeks.
Are dark web markets legal to access?
Accessing the Tor network and visiting dark web sites is legal in most jurisdictions. The legality depends entirely on what is done once there — buying or selling illegal goods, stolen credentials, or illicit services carries criminal liability regardless of the anonymization method used.
What is the dark web monitoring market?
The dark web monitoring and intelligence market — the legitimate security industry that scans dark web forums and markets for stolen organizational data — is valued at approximately $760M–$1.2B in 2025 depending on scope definition, growing at 15–21% CAGR. Major vendors include Recorded Future, DarkOwl, SpyCloud, ZeroFox, and Flare Systems.
What does Operation RapTor tell us about law enforcement effectiveness?
Operation RapTor is the most operationally significant dark web law enforcement action to date by arrests and assets seized. However, Chainalysis data shows aggregate market flows grew YoY in 2025 despite the operation. The consistent pattern across major takedowns (Silk Road 2013, Hydra 2022, RapTor 2025) is disruption without deflation: markets and users migrate to successor platforms within weeks.
Why are healthcare records worth more than credit cards on the dark web?
Credit cards can be canceled and replaced within hours of fraud detection. Healthcare records — containing diagnosis history, prescription data, insurance IDs, and Social Security Numbers — cannot be changed and retain utility for insurance fraud, identity theft, and prescription drug fraud for years. Their non-cancellable nature creates premium value on dark web markets.
What is the Credential-to-Breach Value Multiplier (CBVM)?
The CBVM is an original metric developed by Axis Intelligence Research cross-referencing IBM’s 2025 Cost of a Data Breach Report with dark web IAB market pricing data. It expresses the ratio between the purchase price of corporate network credentials on dark web forums (~$1,000 floor estimate) and the average organizational breach cost when those credentials enable a supply chain or credential-based attack ($4.91 million per IBM 2025). The resulting 4,910× multiplier illustrates the extreme asymmetry of criminal ROI in the credential market.
Primary Sources Referenced
- Chainalysis — 2026 Crypto Crime Report: Drugs and Darknet Markets (March 2026)
- Chainalysis — 2025 Crypto Crime Report Introduction (January 2025)
- U.S. Department of Justice — Operation RapTor press release (May 22, 2025)
- FBI — Global Operation Targets Darknet Drug Trafficking (May 2025)
- IBM — Cost of a Data Breach Report 2025
- Tor Project — Tor Metrics
- Recorded Future — Payment Fraud Intelligence Report 2025 (140M+ credit card records)
- The Business Research Company — Dark Web Intelligence Market Report 2026 (via Research and Markets)
Last updated: May 2026 | Next scheduled update: August 2026 Axis Intelligence Research is the institutional data byline for Axis Intelligence. This report was co-authored with Marcus Chen, Cybersecurity Editor. Methodology and independence disclosures above apply. Axis Intelligence has no commercial relationship with any vendor cited in this report.