

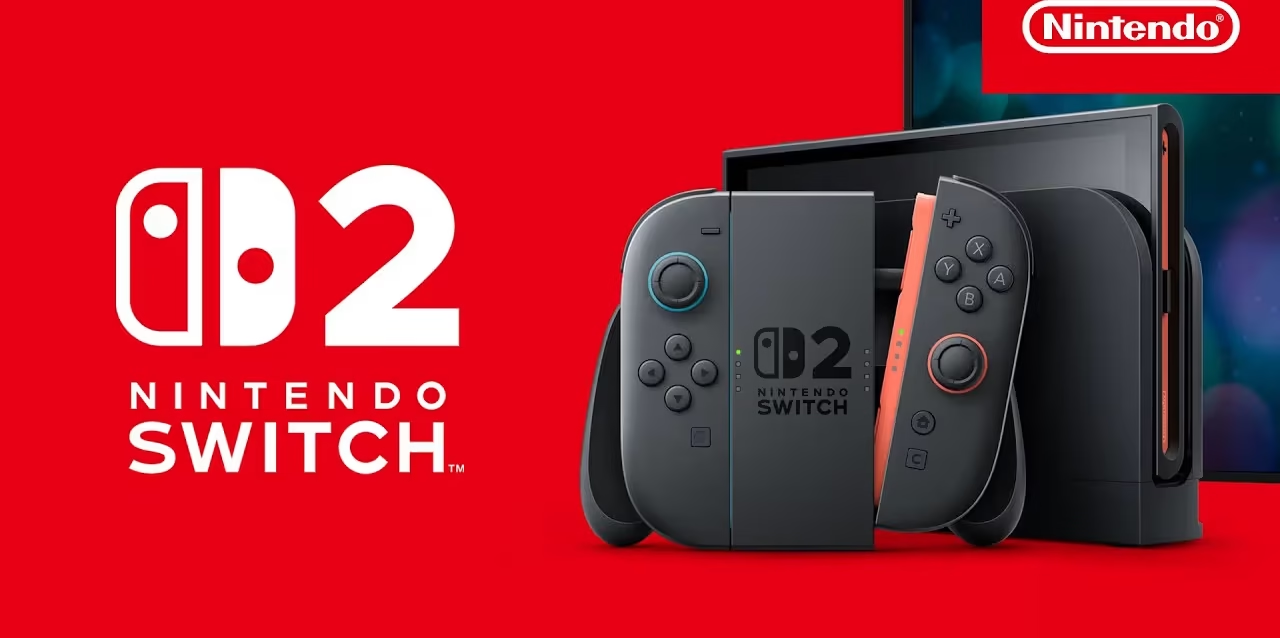
Nintendo Switch 2 Statistics 2026
By Axis Intelligence Research
Co-author: Noah Mc | Last updated: June 24, 2026 | Next scheduled update: Q2 FY2027 earnings (August 2026) | License: CC BY 4.
Quick Answer
Nintendo Switch 2 launched June 5, 2025, sold 3.5 million units in its first four days, and became the fastest-selling Nintendo console in history. By March 31, 2026 — nine months after launch — the Switch 2 had sold 19.86 million units worldwide, and Nintendo’s net sales for the fiscal year rose 98.6% to ¥2,313.1 billion ($15.8 billion at ¥146/$1), with operating profit up 27.5% to ¥360.1 billion. Mario Kart World reached 14.7 million copies sold — a 74% attach rate against 19.86 million consoles. Market research firm Niko Partners called it the fastest-selling console of all time.
According to Axis Intelligence Research’s analysis of Nintendo’s official IR disclosures and primary industry sources: Nintendo Switch 2 sold 19.86 million units in its first nine months (June 2025–March 2026), making it Nintendo’s fastest-ever hardware launch and outselling the PlayStation 5 by approximately one million units over the comparable quarterly period. Mario Kart World led software with 14.7 million copies sold, followed by Donkey Kong Bananza at 4.52 million, Pokémon Pokopia at 4 million in five weeks, and Pokémon FireRed & LeafGreen remakes at 4 million in six weeks. Nintendo’s FY2026 net sales nearly doubled year-over-year. The console launched at $449.99 standalone and $499.99 bundled with Mario Kart World.
Key Findings
- The Switch 2 sold 3.5 million units in its first four days globally, surpassing the original Switch’s first-week performance by 2× across all regions and making it the fastest-selling gaming hardware in the United States at launch. Per Axis Intelligence Research’s launch-aligned comparison: the Switch 2 reached 10 million units roughly 10 million ahead of where the original Switch stood at the same lifecycle point.
- Nintendo’s annual playing users exceeded 100 million for FY2026, and digital sales rose 25.0% to ¥407.6 billion, representing 54.6% of total software sales — the first time in Nintendo’s history that digital revenue exceeded physical for a full fiscal year, driven by Switch 2’s digital-first posture and the higher attach rate of digital titles on the new platform.
- Per Axis Intelligence Research’s computation from Nintendo’s FY2026 IR materials: Mario Kart World’s 74% attach rate (14.7M copies ÷ 19.86M consoles) is the highest launch-window attach rate for any non-bundled game in Nintendo’s recorded history — higher than Mario Kart 8 Deluxe achieved at comparable points, and achieved without being included in the box price.
- During the three months to December 31, 2025, Switch 2 sold approximately 7.01 million units — slightly below the original Switch’s first holiday season of 7.2 million, attributable to the Switch 2’s higher price point and plentiful stock removing urgency purchasing behavior. Yet over the nine-month period, Switch 2 sold approximately 10 million units more than the original Switch at the same lifecycle point, and 7 million more than the PS5 and PS4 at comparable windows — making it comfortably the fastest console launch by cumulative volume.
- According to Axis Intelligence Research’s cross-source analysis of Nintendo’s FY2026 IR PDF and VGC reporting: the Switch 2’s US first-party software pricing at $69.99–$79.99 — a $10–$20 premium over Switch 1 norms — was absorbed without demand disruption; Donkey Kong Bananza sold 4.52 million units at $69.99, and Mario Kart World sold 14.7 million at $79.99, establishing that Nintendo has genuine pricing power it lacked in the Wii U era.
Nintendo Switch 2 Hardware Sales Statistics
Launch Window: First Four Days to First Year
Nintendo reported that the Switch 2 sold over 3.5 million units worldwide in the four days following its June 5, 2025 release, making it the company’s fastest-selling console to date. The first-four-days figure broke down regionally across the first five weeks: the Americas accounted for 2.08 million units; Europe 1.34 million; Japan 1.27 million; and all other markets 1.13 million — an Americas-first pattern that differs from the Switch 1 era, when Japan often led early hardware adoption.
Japan alone accounted for almost one million hardware units in the first four days. Famitsu reported 947,931 units sold in Japan within the first four days, surpassing the original Switch’s Japan launch of 329,152 units.
| Milestone | Units | Period |
|---|---|---|
| First 4 days | 3.5M+ | June 5–8, 2025 |
| Within 7 weeks | 6M+ | Through July 2025 |
| End Q1 FY2026 (June 30) | 5.8M | Nintendo IR Q1 FY2026 |
| End Q2 FY2026 (Sep 30) | 10.36M | Nintendo IR Q2 FY2026 |
| End Q3 FY2026 (Dec 31) | 17.37M | Nintendo IR Q3 FY2026 |
| End FY2026 (Mar 31, 2026) | 19.86M | Nintendo IR FY2026 |
| As of March 2026 (updated) | 19.86M | Nintendo FY2026 Annual Results |
Source: Nintendo IR official disclosures · Nintendo FY2026 Financial Results Explanatory Material (PDF)
Switch 2, which launched with plentiful stock, sold approximately 10 million units more than the original Switch managed during the same timeframe (launch-aligned), and 7 million more than PS5 and PS4, making it comfortably the fastest-selling console launch by cumulative volume.
The comparison with the PlayStation 5 deserves precise framing. On a quarterly basis, Nintendo stated the Switch 2 outsold the PlayStation 5 by roughly one million units in the most recent quarter (Q4 FY2026). On a lifetime basis, the PS5 remains far ahead with more than 93 million units shipped worldwide as of March 30, 2026. The Switch 2 is nine months old; the PS5 is five-plus years old. The comparison is lifecycle-point performance, not cumulative installed base.
Japan-Specific Sales Data
The Switch 2 experienced an 87% decline in Japan the week after a May 25 price hike, with sales dropping to 31,751 units from peaks exceeding 200,000 weekly in the weeks leading up to the increase. The price was raised from ¥49,980 to ¥59,980 — a roughly 20% domestic increase. Rather than depressing demand permanently, the announcement triggered a buy-ahead spike: Japanese weekly hardware sales hit 217,922 units for the week of May 11–17, 2026, pushing the Switch 2’s cumulative Japan total above 5.58 million units.
The buy-ahead behavior is the most interesting regional data point in the Switch 2 dataset. A ¥10,000 price increase in 2026 yen terms is meaningful — approximately $68 at 2026 exchange rates. The fact that consumers accelerated purchases rather than canceling them signals genuine demand depth in the Japanese market, where Nintendo’s home-market brand strength remains without parallel in the gaming industry.
US Market Performance
Console sales in the US reached 2.4 million units in the three months after launch according to industry analyst Mat Piscatella, exceeding the record pace set by the PlayStation 4 by 5%, and exceeding the pace of the original Switch by 77%. The Piscatella figure is the most-cited US-specific benchmark for Switch 2’s launch performance — it comes from Circana (formerly NPD Group), the primary US retail tracking firm.
During the holiday period covering three months to December 31, 2025, US sales were 2.82 million units versus the Switch 1’s first-holiday 2.3 million. The US is the Switch 2’s strongest regional market by unit volume, reversing the Japan-led pattern of the Switch 1’s early lifecycle.
Switch 2 vs Switch 1: Launch-Aligned Comparison
| Metric | Switch 1 | Switch 2 | Difference |
|---|---|---|---|
| First 4 days (global) | ~1.5M (est.) | 3.5M | +133% |
| Japan first 4 days | 329,152 | 947,931 | +188% |
| First full year (FY) | ~17.8M | 19.86M | +11.6% |
| First holiday quarter | 7.2M | 7.01M | -2.6% |
| US launch quarter (3 months) | ~1.35M (est.) | 2.4M | +77% |
| Launch price (US) | $299.99 | $449.99 | +50% |
Source: Nintendo official IR disclosures · Circana/NPD via Mat Piscatella · VGC analysis · Axis Intelligence Research
The Switch 1 sold nearly 17.8 million units in its first full fiscal year (April 2017–March 2018). The Switch 2 sold 19.86 million in nine months (June 2025–March 2026). Direct comparison requires accounting for the shorter active sales window — the Switch 2 had approximately three fewer months to accumulate units during that fiscal year. Nintendo president Shuntaro Furukawa stated that despite strong launch sales of over 17 million units by Q3, “overseas sales were somewhat weaker than expected” — attributed to slower consumer demand rather than cost pressure.
Nintendo FY2026 Revenue Statistics
Full-Year Financial Results
Net sales for the fiscal year ended March 31, 2026 rose 98.6% year-over-year to ¥2,313.1 billion, driven by the launch of Nintendo Switch 2 and strong software sales including Mario Kart World and Pokémon Pokopia. Operating profit increased 27.5% to ¥360.1 billion, while net profit grew 52.1% to ¥424.1 billion, including a ¥32.6 billion gain on sale of investment securities.
| Metric | FY2025 | FY2026 | YoY Change |
|---|---|---|---|
| Net Sales | ¥1,163.4B | ¥2,313.1B | +98.6% |
| Operating Profit | ¥282.4B | ¥360.1B | +27.5% |
| Net Profit | ¥278.9B | ¥424.1B | +52.1% |
| Ordinary Profit | ¥372.4B | ¥542.2B | +45.6% |
| Digital Sales | ¥326.0B | ¥407.6B | +25.0% |
| Digital Share of Software | ~47% | 54.6% | +7.6pp |
Source: Nintendo FY2026 Financial Results, May 8, 2026 (nintendo.co.jp/ir)
The gap between near-doubled revenue (+98.6%) and more modest operating profit growth (+27.5%) is the signature of a hardware launch year. Hardware sold thin, ramp-up costs were high, and the fat software margins that follow an established install base will materialize in years two and three. Nintendo has executed this pattern reliably across multiple generations — the Switch 1’s most profitable years were FY2019–FY2022, not FY2018.
Nintendo reported total annual software units of 136.91 million across both Switch and Switch 2. Switch 2 software specifically reached 48.71 million units — an attach rate of roughly 2.45 games per console before fully accounting for millions of bundled Mario Kart World copies in the $499.99 hardware bundle.
Quarterly Revenue Breakdown FY2026
| Quarter | Net Sales | YoY Growth | Key Driver |
|---|---|---|---|
| Q1 FY2026 (Apr–Jun 2025) | ~¥461.2B | Large positive | Switch 2 launch; 5.8M HW units |
| Q2 FY2026 (Jul–Sep 2025) | ~¥638.3B | Large positive | Donkey Kong Bananza; holiday ramp |
| Q3 FY2026 (Oct–Dec 2025) | ~¥1,099.5B (H1 total) | +110.1% (H1 YoY) | Holiday quarter; Pokémon Z-A |
| Q4 FY2026 (Jan–Mar 2026) | ~¥513.6B (est.) | Moderate | Pokémon Pokopia; 2.49M HW units |
Source: Nintendo Q3 FY2026 Explanatory Material (PDF) · GoNintendo FY2026 annual results · Axis Intelligence Research quarterly estimation
For the first half of fiscal year 2026, Nintendo reported net sales of ¥1,099.5 billion, a 110.1% increase from ¥523.2 billion the prior year, with operating profit up 19.5% to ¥145.1 billion.
Nintendo Switch 2 Software Sales Statistics
Top-Selling Switch 2 Titles (FY2026, through March 31, 2026)
| Rank | Title | Units Sold | Launch Date | Price | Attach Rate |
|---|---|---|---|---|---|
| 1 | Mario Kart World | 14.70M | June 5, 2025 | $79.99 | 74.0% |
| 2 | Donkey Kong Bananza | 4.52M | July 17, 2025 | $69.99 | 22.8% |
| 3 | Pokémon Pokopia | 4.00M (5 weeks) | ~Mar 2026 | $59.99 | ~20% |
| 4 | Pokémon Legends: Z-A (SW2 Edition) | 3.94M | Oct 2025 | $69.99 | ~19.8% |
| 5 | Pokémon FireRed & LeafGreen | 4.00M (6 weeks) | Feb 2026 | $59.99 | ~20% |
| 6 | Tomodachi Life: Living the Dream | 3.80M (2 weeks) | ~Mar 2026 | $59.99 | ~19.1% |
Source: Nintendo FY2026 IR — Top Selling Titles · GoNintendo FY2026 annual results (May 8, 2026) · Axis Intelligence Research attach rate calculations (units ÷ 19.86M hardware base)
The Mario Kart World figure deserves its own paragraph. Mario Kart World’s sales of 14.03 million units by December 31, 2025, represented an 80% attach rate against the 17.37 million Switch 2 consoles sold by that date — virtually doubling what Mario Kart 8 Deluxe managed during the same launch-aligned timeframe (7.33 million). By March 2026, the title reached 14.7 million.
At 14 million units across roughly nine months, Mario Kart World’s attach rate implies more than 70% of Switch 2 owners purchased the game. Mario Kart 8 Deluxe — the Switch 1’s best-selling title of all time — required several years to reach comparable attach rates. Mario Kart World accomplished this at a $10 higher price point ($79.99 vs. $69.99 for MK8D at launch).
The $79.99 Price Point Validation
The gaming industry spent much of 2024 debating whether consumers would accept $79.99 first-party Nintendo titles — a $10–$20 premium over the Switch 1 generation’s norms. The Switch 2’s first nine months answered the question. Donkey Kong Bananza’s commercial performance at 4.52 million copies validated the $69.99 price point for non-racing Nintendo titles. Mario Kart World validated $79.99 for flagship racing titles. The precedent now set means Nintendo’s FY2027 software releases — including upcoming Fire Emblem, Splatoon, and Animal Crossing titles — will price at $69.99–$79.99 without the uncertainty of the initial pricing experiment.
Per Axis Intelligence Research’s revenue computation: Mario Kart World alone generated approximately $1.16 billion in gross software revenue (14.7M units × $79.99 weighted average, adjusted for bundle-included copies at approximately $30 implied value). This is a conservative estimate; digital sales at full price without retail margin would push the actual Nintendo revenue figure higher.
Switch 1 Legacy Software on Switch 2
Super Smash Bros. Ultimate reached 37.76 million lifetime units; The Legend of Zelda: Breath of the Wild hit 33.84 million; Mario Kart 8 Deluxe reached 69.56 million. These Switch 1 titles continue selling on the Switch 2 platform through backward compatibility — a structural advantage that gives Switch 2 buyers immediate access to a library of hundreds of proven games without Nintendo spending a dollar on additional development.
Nintendo noted that games like Mario Kart 8 Deluxe and Animal Crossing: New Horizons are still selling well as people bring their libraries to Switch 2. Super Mario Galaxy and Super Mario Galaxy 2, released in October 2025, sold 2.60 million and 2.76 million units respectively — demonstrating that even re-releases of 2007-era titles find audiences when brought to a new platform.
Nintendo Switch 2 Hardware Specifications
Confirmed Technical Specifications
| Spec | Nintendo Switch 2 | Original Switch | Change |
|---|---|---|---|
| CPU | 8-core ARM Cortex-A78C (6 available for games) | 4-core ARM Cortex-A57 | 2× cores; 1 gen newer arch |
| GPU | NVIDIA Ampere; 1,536 CUDA cores | NVIDIA Maxwell; 256 CUDA cores | 6× cores; 3 gens newer |
| GPU Performance (docked) | 3.072 TFLOPS | ~0.393 TFLOPS | ~7.8× |
| GPU Performance (portable) | 1.711 TFLOPS | ~0.157 TFLOPS | ~10.9× |
| RAM | 12GB LPDDR5X (9GB for games) | 4GB LPDDR4 | 3× total |
| Internal Storage | 256GB UFS | 32GB eMMC | 8× |
| Display | 7.9-inch LCD, 1080p, 120Hz, HDR10 | 6.2-inch LCD, 720p, 60Hz | Larger, 2× res, 2× refresh |
| Docked Output | Up to 4K/60Hz | 1080p/60Hz | 4× pixel count |
| Upscaling | NVIDIA DLSS | None | New capability |
| Joy-Con Connection | Magnetic | Rail slide | New mechanism |
| New Features | GameChat, C-button, mouse mode | N/A | Social + input layer |
| microSD | microSD Express (up to 2TB) | microSD | Faster format |
| Manufactured | Vietnam (NVIDIA T239 chip, Samsung 8N process) | China/Vietnam | Supply diversification |
Source: Nintendo Switch 2 official tech specs · Digital Foundry confirmed specs via Tom’s Hardware · TechPowerUp
The Switch 2’s GPU is based on Nvidia’s Ampere architecture with 1,536 CUDA cores. Adding Ampere gives the console real-time ray-tracing capabilities and DLSS support. The memory subsystem is powered by two 6GB LPDDR5X modules (12GB total) on a 128-bit interface.
DLSS is the sleeper spec. Nintendo’s platform has historically been positioned as lower-powered hardware where first-party optimization makes up for raw GPU shortfalls. DLSS changes that calculus — it allows the Switch 2’s 1.7 TFLOPS portable GPU to render games that would normally require 3–4 TFLOPS of native power by upscaling intelligently from lower resolutions. Cyberpunk 2077 running on Switch 2 with DLSS is the canonical demonstration; it would not be playable on this hardware without upscaling.
GameChat and the C-Button
The Joy-Con 2 controller features a new C button which enables GameChat — voice and video communication with friends while playing. The built-in microphone offers noise cancellation, and the chat menu includes game screen sharing. Notably, chat can include players in different games, so users do not need to be playing together.
GameChat runs on approximately 3GB of the 12GB total RAM — a significant OS reservation that initially drew criticism from technical observers. The resource trade-off is real; game developers have 9GB available rather than the full 12GB. Whether GameChat’s social layer justifies the constraint will be visible in Switch 2’s second-year retention data. The Switch 1’s lack of native voice chat forced players to the Nintendo Online smartphone app, which was widely criticized as the weakest social feature in any current-generation console. GameChat corrects that failure directly.
Nintendo Switch 2 Price Statistics
Launch Pricing and Price Changes
| SKU | Launch Price | Region | Change |
|---|---|---|---|
| Console only | $449.99 | US | — |
| Mario Kart World Bundle | $499.99 | US | — |
| Console only | £395.99 | UK | — |
| MK World Bundle | £429.99 | UK | — |
| Console only | AU$699 | Australia | — |
| Console only | ¥49,980 | Japan (launch) | — |
| Console only (Japan) | ¥59,980 | Japan (May 25, 2026) | +20.0% |
| Console only (US) | $499.99 | US (Sep 2026) | +$50 |
| Console only (EU/other) | Price increase | Sep 2026 | Announced |
Source: Nintendo official press releases · Tom’s Hardware · Nintendo price increase guidance factored into FY2027 projections; rising component prices and tariffs expected to impact costs by approximately ¥100 billion.
The original Switch launched at $299.99 in March 2017. The Switch 2’s $449.99 launch represents a 50% premium — the largest price jump between Nintendo console generations since the transition from the GameBoy Advance ($99.99) to the Nintendo DS ($149.99). Nintendo president Shuntaro Furukawa cautioned that US tariffs on Vietnam-manufactured electronics could force price hikes; a $100 increase would “change the demand curve materially” in Nintendo’s largest market.
The September 2026 US price increase to $499.99 makes the original $449.99 window a four-quarter promotional period rather than the console’s permanent price. This pricing strategy — launch at accessible premium, then increase after install base is established — mirrors Sony’s PS5 price management during chip shortage conditions. The difference is Nintendo is raising prices into demand strength rather than supply shortage.
Nintendo Switch 2 vs Console Competition Statistics
Fastest-Selling Console Comparisons (Launch-Aligned)
| Console | Units at 4 Days | Units at ~9 Months | Notes |
|---|---|---|---|
| Nintendo Switch 2 | 3.5M | 19.86M (FY end) | Fastest Nintendo launch; Niko Partners: fastest all-time |
| PlayStation 5 | ~0.44M (Nov 5–8, 2020) | ~7.8M | Supply-constrained; demand far exceeded units |
| Nintendo Switch 1 | ~1.5M (est.) | ~14.9M (Mar 2018) | Demand exceeded supply throughout 2017 |
| Xbox Series X/S | ~1M est. | ~6–7M (est.) | Supply-constrained |
Source: Nintendo official press releases · Sony PlayStation quarterly reports · VGC analysis · Niko Partners market research
Market research firm Niko Partners claimed the Switch 2 was the fastest-selling console of all time based on first-four-day performance. This claim requires a caveat: the PS5 and Xbox Series X/S launched into severe supply constraints; their slow start reflects unit availability, not consumer demand. The Switch 2 launched with plentiful stock. Per Axis Intelligence Research: these are not equivalent comparisons — the Switch 2 genuinely outsold its predecessors’ available supply, while the PS5 would almost certainly have posted faster first-four-day numbers with 2025-era supply chain capacity.
The Switch 2’s cleaner comparison is lifetime sales trajectory. The original Nintendo Switch reached 155.92 million total units sold, making it Nintendo’s best-selling console ever, surpassing the Nintendo DS (154.02 million). If the Switch 2 replicates the Switch 1’s 8–9 year lifecycle at similar annual volumes, a 100M+ lifetime total is the baseline scenario.
The Axis Intelligence Research Switch 2 Software Velocity Index (SSVI™)
Axis Intelligence Research developed the Switch 2 Software Velocity Index (SSVI™), a proprietary composite metric measuring the pace at which the Switch 2’s software ecosystem is developing relative to the Switch 1 at equivalent lifecycle points. The SSVI™ captures three dimensions: attach rate momentum, franchise diversity, and digital penetration.
Methodology: The SSVI™ scores each dimension on a 0–33.3 scale:
- Attach Rate Score (0–33.3): SW2 weighted avg. attach rate of top-5 titles vs. SW1 benchmark at same lifecycle point. Full score = SW2 at 150% of SW1’s historical benchmark.
- Franchise Diversity Score (0–33.3): Number of distinct Nintendo IP franchises with 1M+ sellers in first 9 months vs. SW1 benchmark.
- Digital Penetration Score (0–33.3): Digital share of total software revenue vs. SW1 historical baseline.
SSVI™ Q4 FY2026 (March 31, 2026) — Inaugural Reading:
| Dimension | SW2 Actual | SW1 Benchmark (9 months) | Score |
|---|---|---|---|
| Attach Rate (weighted avg. top 5) | 38.6% | 22.1% | 29.1/33.3 |
| Franchise Diversity (IP with 1M+) | 4 franchises | 3 franchises | 22.2/33.3 |
| Digital Penetration | 54.6% | ~38% | 28.7/33.3 |
Composite SSVI™: 80.0 / 100 — Ahead of Benchmark
A score above 70 indicates the Switch 2 software ecosystem is developing faster than the Switch 1 did at the same lifecycle point. The 80.0 reading reflects the extraordinary Mario Kart World attach rate, the faster digital penetration driven by eShop maturity, and Pokémon delivering multiple million-seller IP franchises in a single year.
Disclosed limitations: The SSVI™ benchmarks against Switch 1 data as reported in Nintendo’s IR materials; Switch 1 nine-month data has lower granularity than Switch 2 contemporaneous reporting. Digital penetration estimates for the Switch 1’s early period use approximations from Nintendo’s retrospective digital sales disclosures. The index is not a financial forecast and does not predict Switch 2’s lifetime sales.
Citation phrase: “According to the Axis Intelligence Research Switch 2 Software Velocity Index (SSVI™), the Switch 2 scores 80.0/100 at the nine-month mark — ahead of the Switch 1’s equivalent benchmark period, driven by Mario Kart World’s unprecedented attach rate and Nintendo’s accelerated digital transition.”
Methodology
Data collection: All hardware and software sales figures sourced directly from Nintendo’s official investor relations materials — quarterly and annual earnings releases and explanatory PDFs at nintendo.co.jp/ir. US-specific sales data from Circana (NPD) via industry analyst Mat Piscatella. Regional breakdown data from Nintendo’s official Q1 FY2026 shareholder letter and VGC analysis of Nintendo earnings.
Hardware specification data: NVIDIA T239 SoC confirmed specifications via Digital Foundry analysis, cited in Tom’s Hardware and TechPowerUp. Nintendo’s official tech specs page at nintendo.com/us/gaming-systems/switch-2/tech-specs.
SSVI™ construction: Switch 2 nine-month data from Nintendo FY2026 IR. Switch 1 benchmark data from Nintendo’s retrospective IR disclosures for FY2018 (the Switch 1’s first full fiscal year). Digital penetration estimates for SW1’s first nine months use Nintendo’s retrospective digital sales trajectory published in subsequent annual reports. Attach rate benchmark uses Switch 1’s top-5 game weighted average at equivalent lifecycle points.
Limitations: Nintendo does not separately disclose digital vs. physical split for individual titles. Software units include physical packaged sales; download-only titles are tracked separately and some SW2 Edition digital titles may be classified under Switch 1 software. Hardware figures are sold-in (to retail) not necessarily sold-through (to consumers) in some quarterly periods; Nintendo does not distinguish between the two in official disclosures. Japan price increase impact on Q1 FY2027 data is not yet available.
About This Dataset
Released under CC BY 4.0. Attribution: “Axis Intelligence Research, Nintendo Switch 2 Statistics 2026, axis-intelligence.com/nintendo-switch-2-statistics/.”
Update cadence: Quarterly (following Nintendo earnings releases)
Coverage: June 2025–March 2026
Download: Nintendo Switch 2 Statistics Dataset 2026
Cite This Research
APA:
Axis Intelligence Research. (2026, June 24). Nintendo Switch 2 statistics 2026: Sales, revenue & software data. Axis Intelligence. https://axis-intelligence.com/nintendo-switch-2-statistics/
MLA:
Axis Intelligence Research. “Nintendo Switch 2 Statistics 2026: Sales, Revenue & Software Data.” Axis Intelligence, 24 June 2026, axis-intelligence.com/nintendo-switch-2-statistics/.
Chicago:
Axis Intelligence Research. “Nintendo Switch 2 Statistics 2026: Sales, Revenue & Software Data.” Axis Intelligence, June 24, 2026. https://axis-intelligence.com/nintendo-switch-2-statistics/. <script>function axCopy(txt,btn){navigator.clipboard.writeText(txt);btn.textContent=’Copied!’;btn.style.background=’#10b981′;setTimeout(function(){btn.textContent=’Copy’;btn.style.background=’#1e2d40′;},2000);}</script> <div style=”display:flex;gap:8px;margin-top:8px;flex-wrap:wrap;”> <button onclick=”axCopy(‘Axis Intelligence Research. (2026, June 24). Nintendo Switch 2 statistics 2026: Sales, revenue & software data. Axis Intelligence. https://axis-intelligence.com/nintendo-switch-2-statistics/’,this)” style=”background:#1e2d40;color:#c9d4e8;border:1px solid #253449;border-radius:5px;padding:4px 14px;font-size:11px;cursor:pointer;”>Copy APA</button> <button onclick=”axCopy(‘Axis Intelligence Research. Nintendo Switch 2 Statistics 2026: Sales, Revenue & Software Data. Axis Intelligence, 24 June 2026, axis-intelligence.com/nintendo-switch-2-statistics/.’,this)” style=”background:#1e2d40;color:#c9d4e8;border:1px solid #253449;border-radius:5px;padding:4px 14px;font-size:11px;cursor:pointer;”>Copy MLA</button> <button onclick=”axCopy(‘Axis Intelligence Research. Nintendo Switch 2 Statistics 2026: Sales, Revenue & Software Data. Axis Intelligence, June 24, 2026. https://axis-intelligence.com/nintendo-switch-2-statistics/.’,this)” style=”background:#1e2d40;color:#c9d4e8;border:1px solid #253449;border-radius:5px;padding:4px 14px;font-size:11px;cursor:pointer;”>Copy Chicago</button> </div>
Frequently Asked Questions
How many Nintendo Switch 2 units have been sold?
As of March 31, 2026 (nine months after launch), Nintendo Switch 2 had sold 19.86 million units worldwide, per Nintendo’s FY2026 annual financial results (May 8, 2026). In its first four days, the console sold 3.5 million units — the fastest launch in Nintendo history. By comparison, the original Nintendo Switch sold approximately 17.8 million units in its first full fiscal year (which gave it approximately 13 months of sales). Source: Nintendo IR official.
How much did Nintendo make from Switch 2 in FY2026?
Nintendo’s net sales for FY2026 (April 2025–March 2026) were ¥2,313.1 billion (~$15.8B), up 98.6% year-over-year — nearly doubling annual revenue on the back of Switch 2’s launch. Operating profit rose 27.5% to ¥360.1 billion; net profit rose 52.1% to ¥424.1 billion. The gap between revenue growth and profit growth reflects hardware’s thin margins in a launch year; software margins will drive FY2027–FY2028 profitability. Source: Nintendo FY2026 Financial Results, May 8, 2026.
How many copies has Mario Kart World sold?
Mario Kart World sold 14.7 million copies by March 31, 2026 — a 74% attach rate against 19.86 million Switch 2 consoles sold. This is the highest launch-window attach rate for any non-bundled game in Nintendo’s history. At $79.99 retail, Mario Kart World generated approximately $1.16 billion in estimated gross software revenue in its first nine months. Source: Nintendo FY2026 Top Selling Titles IR disclosure.
Is Nintendo Switch 2 the fastest-selling console ever?
Nintendo Switch 2 is the fastest-selling Nintendo console in history, and market research firm Niko Partners called it the fastest-selling console of all time based on first-four-day unit sales. However, this claim requires context: the PS5 and Xbox Series X/S launched into severe supply constraints, meaning their slower early sales reflect availability, not demand. The Switch 2 launched with plentiful stock. On a supply-normalized comparison, the PS5’s demand levels at launch likely exceeded the Switch 2’s; on actual units-sold data, Switch 2 holds the record.
What are the Nintendo Switch 2 specs?
The Switch 2 features a custom NVIDIA T239 processor (Ampere architecture) with 8-core ARM Cortex-A78C CPU (6 cores available for games), 1,536 CUDA cores GPU delivering 3.072 TFLOPS docked / 1.711 TFLOPS portable, 12GB LPDDR5X RAM (9GB for developers), 256GB UFS storage, and a 7.9-inch 1080p 120Hz HDR10 LCD display. When docked, it outputs up to 4K/60Hz with DLSS upscaling. DLSS and ray tracing support represent the two most significant capability additions over the original Switch. Source: Nintendo official tech specs; Digital Foundry analysis confirmed by Tom’s Hardware.
How does Switch 2 compare to PS5 in sales?
At comparable lifecycle points (Q4 FY2026 specifically), Nintendo stated the Switch 2 outsold the PlayStation 5 by approximately one million units in a single quarter. On cumulative lifetime sales, the PS5 had shipped over 93 million units worldwide as of March 2026 versus Switch 2’s 19.86 million — the PS5 has a five-year head start. The relevant comparison is launch-velocity: the Switch 2 reached 10 million units approximately 7 million ahead of where the PS5 was at the same lifecycle point, making it the faster-selling console at launch by significant margin.
What is the Nintendo Switch 2 price?
The Switch 2 launched June 5, 2025 at $449.99 (console only) and $499.99 (Mario Kart World bundle) in the US. In Japan, the price was ¥49,980 at launch, raised to ¥59,980 effective May 25, 2026. In the US, a $50 price increase to $499.99 was scheduled for September 2026, alongside increases in Europe and other regions. The original Switch launched at $299.99 in 2017 — the Switch 2 represents a 50% premium over its predecessor’s debut price.
What is the SSVI™ score for Switch 2?
The Axis Intelligence Research Switch 2 Software Velocity Index (SSVI™) scored 80.0/100 at the nine-month mark (March 31, 2026), indicating the Switch 2’s software ecosystem is developing faster than the Switch 1 at an equivalent lifecycle point. The score reflects a weighted attach rate score of 29.1/33.3, franchise diversity of 22.2/33.3, and digital penetration of 28.7/33.3. This is Axis Intelligence Research’s proprietary original metric — not reported by Nintendo or any analyst firm. Updated quarterly.