

Waymo Statistics 2026
By Axis Intelligence Research
Co-author: Liam Michael | Last updated: November 6, 2026 | License: CC BY 4.0
Waymo’s last disclosed weekly volume is 500,000 fully autonomous rides, reported by Alphabet on April 29, 2026, against a company target of 1 million per week by the end of 2026. Since then Waymo has added cities, miles and a $5 billion loan, but no new weekly ride count. Axis Intelligence Research estimates the 1-million goal needs roughly 7,600 vehicles at current utilization.
Quick Answer
Waymo operates fully autonomous paid rides in 15 U.S. cities and has driven more than 300 million fully autonomous miles, per Alphabet’s October 28, 2026 earnings call. Its last disclosed volume is 500,000 rides per week (April 2026). Across 271.3 million rider-only miles through June 2026, Waymo was involved in 95% fewer serious-injury-or-worse crashes than human drivers in the same cities, per Waymo’s Safety Impact Data Hub.
Key Findings
- Axis Intelligence Research finds that San Francisco produced 59% of Waymo’s avoided injury crashes while accounting for 30% of its rider-only miles, based on Waymo’s city-level crash rates and mileage through June 2026.
- Waymo’s Injury Avoidance Yield (IAY) is 3.10 injury crashes avoided per million rider-only miles across five cities, and 6.04 in the San Francisco Bay Area, an Axis Intelligence Research calculation from Waymo Safety Impact Data Hub figures through June 2026.
- California generated 69.9% of Waymo’s 15 million rides in 2025, Axis Intelligence Research calculates by dividing 10,477,651 trips Waymo reported to the California Public Utilities Commission (CPUC) by Waymo’s company-reported annual total.
- Axis Intelligence Research estimates Waymo runs about 132 paid rides per vehicle per week, dividing Alphabet’s 500,000 weekly rides (April 29, 2026) by the 3,791-vehicle population in NHTSA recall 26E026 (May 11, 2026).
- Alphabet’s Other Bets segment, which houses Waymo, lost $5.95 billion in the first nine months of 2026, up 52.5% from $3.90 billion a year earlier, while segment revenue stayed flat at $1.17 billion, per Alphabet’s quarterly earnings releases.
How Many Rides Does Waymo Give per Week?
Waymo’s most recent official figure is more than 500,000 fully autonomous rides per week, stated by Alphabet CEO Sundar Pichai in the Q1 2026 earnings release on April 29, 2026. That figure doubled from 250,000 paid rides per week reported on Alphabet’s Q1 2025 earnings call (CNBC, April 24, 2025).
Waymo Weekly Rides: Disclosed Milestones
| Date | Weekly rides | Cities served | Source |
|---|---|---|---|
| April 24, 2025 | 250,000+ (paid) | 4 | Alphabet Q1 2025 call, reported by CNBC |
| February 2, 2026 | 400,000+ | 6 | Waymo funding announcement |
| April 29, 2026 | 500,000+ | — | Alphabet Q1 2026 earnings release |
| End of 2026 (target) | 1,000,000 | — | Waymo 2025 year in review |
How Many Total Rides Has Waymo Completed?
Waymo completed 15 million rides in 2025 and passed 20 million lifetime rides by year-end, per a dated footnote in its 2025 year-in-review post. The body of that same post, written December 10, said “over 14 million trips so far,” which is why both numbers circulate; 15 million is the final full-year figure. Riders spent more than 3.8 million hours in Waymo vehicles in 2025.
Liam Michael, Robotics: The interesting number is the one that isn’t there. Between April and October 2026 Waymo went from roughly ten markets to fifteen and opened three of them to the public, yet Alphabet’s October call reported miles and cities, not weekly rides. New cities ramp slowly: Waymo said it had welcomed “hundreds of thousands of riders” in San Antonio, San Diego and Tampa combined before opening them to everyone on October 14. Hitting 1 million a week means the mature cores in Phoenix, San Francisco and Los Angeles have to carry most of the second doubling. Show me the next weekly count and I’ll move the number.
How Many Cars Does Waymo Have?
Waymo does not publish a fleet census, but federal recall filings give a floor. NHTSA recall 26E026 (flooded roadways, May 11, 2026) covered 3,791 vehicles running 5th- and 6th-generation Waymo Driver systems. Recall 26E035 (freeway construction zones, June 17, 2026) covered 3,871 vehicles with the 5th-generation system alone.
A recall population is the set of vehicles carrying the affected software, not a daily count of cars in service, so treat it as the best public proxy rather than an exact fleet size.
Rides per Vehicle and the 1-Million Gap
The Ride Density Index (RDI), an existing Axis Intelligence Research metric defined on our robotaxi statistics page, divides weekly paid rides by fleet size.
| Input | Value | Source |
|---|---|---|
| Weekly rides | 500,000 | Alphabet, April 29, 2026 |
| Fleet proxy | 3,791 vehicles | NHTSA 26E026, May 11, 2026 |
| RDI | 131.9 rides per vehicle per week | Axis Intelligence Research calculation |
| Vehicles needed for 1,000,000 weekly rides at that RDI | 7,582 | Axis Intelligence Research calculation |
Using the 3,871-vehicle 5th-generation population instead gives an RDI of 129.2. Either way, the answer is the same: Waymo needs about twice today’s vehicle count, or materially higher rides per vehicle, to reach its year-end goal.
Which Vehicles Does Waymo Use?
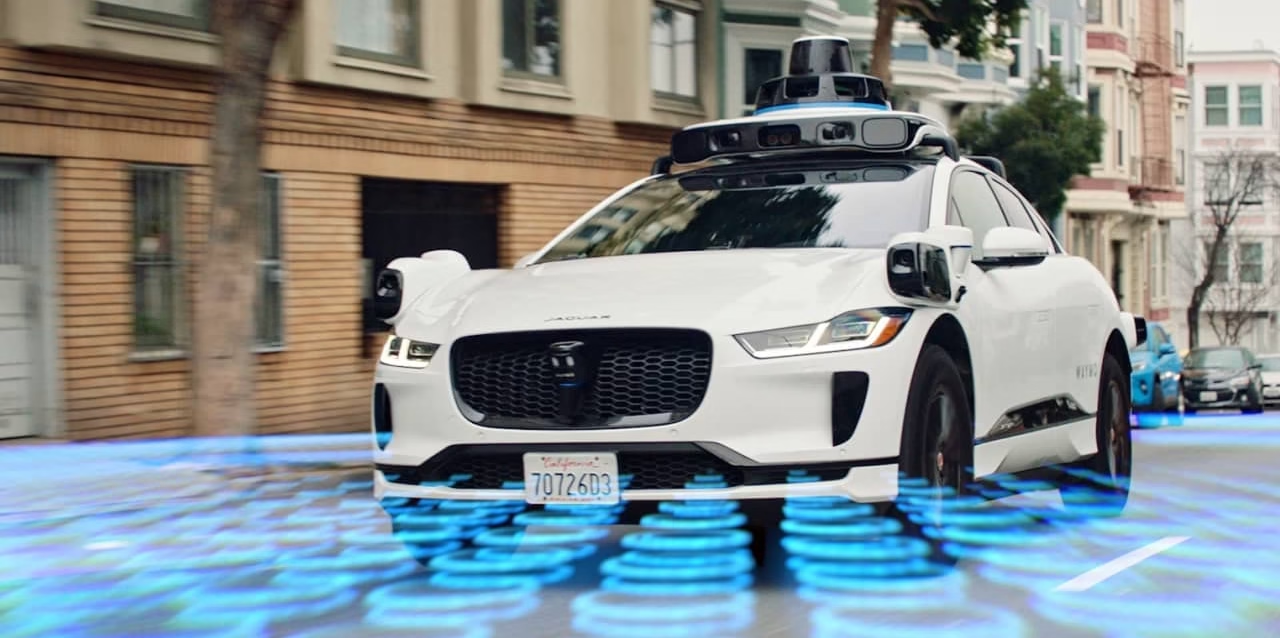
Waymo’s fleet runs on the Jaguar I-PACE (5th-generation Waymo Driver) and the Ojai, the first vehicle with the 6th-generation Waymo Driver. Waymo began welcoming public riders into the Ojai on May 28, 2026, initially in San Francisco, Phoenix and Los Angeles, and says its Mesa, Arizona integration plant is scaling toward “tens of thousands of units per year.” On October 30, 2026, Waymo and Toyota said a Toyota bZ4X autonomous fleet will begin test and validation operations in Japan in 2027.
How Many Remote Operators Does Waymo Use?
Waymo told Senator Ed Markey in February 2026 that about 70 remote assistance agents are on duty worldwide at any given time, split across Arizona, Michigan and two cities in the Philippines (Reuters, February 17, 2026). Waymo says these agents answer questions from the Waymo Driver and do not steer the vehicle. Against the roughly 3,000 vehicles cited at the time, that is about 43 vehicles per on-duty agent, an Axis Intelligence Research calculation.
Is Waymo Safer Than Human Drivers?
Yes, in the cities where it operates, by a wide and statistically significant margin. Through June 2026, across 271.3 million rider-only miles in Phoenix, San Francisco, Los Angeles, Austin and Atlanta, the Waymo Safety Impact Data Hub reports these reductions against an average human driver covering the same distance on the same roads:
| Crash outcome | Reduction vs. human benchmark | Fewer crashes | Source |
|---|---|---|---|
| Serious injury or worse | 95% | 55 | Waymo Safety Impact Data Hub |
| Airbag deployment (any vehicle) | 82% | 357 | Waymo Safety Impact Data Hub |
| Any injury reported | 82% | 841 | Waymo Safety Impact Data Hub |
| Pedestrian injury crashes | 93% | 87 | Waymo Safety Impact Data Hub |
| Cyclist injury crashes | 86% | 56 | Waymo Safety Impact Data Hub |
| Motorcyclist injury crashes | 82% | 36 | Waymo Safety Impact Data Hub |
Two definitions matter here. Rider-only miles are miles driven with no human driver aboard. IPMM (incidents per million miles) is the crash rate per million vehicle miles; Waymo compares its IPMM with human benchmarks built from police-reported crashes, adjusted to the parts of each city Waymo actually drives. The data counts every crash regardless of fault, and Waymo publishes the underlying NHTSA Standing General Order (SGO) report IDs so outside researchers can reproduce it.
The data does not yet cover freeways or snow. Waymo’s hub states that freeway miles are too few for a statistical comparison and that its current cities have no appreciable snowfall.
Waymo Crash Rates by City
| City | Rider-only miles (through June 2026) | Waymo any-injury IPMM | Human benchmark IPMM | Waymo serious-injury IPMM | Human serious-injury IPMM |
|---|---|---|---|---|---|
| Phoenix | 92.1M | 0.56 | 1.95 | 0.01 | 0.10 |
| San Francisco Bay Area | 82.4M | 0.67 | 6.71 | 0.02 | 0.39 |
| Los Angeles | 67.1M | 0.86 | 2.49 | 0.00 | 0.15 |
| Austin | 21.1M | 0.52 | 3.25 | 0.00 | 0.17 |
| Atlanta | 8.6M | 0.81 | 6.44 | 0.00 | 0.22 |
| All five cities | 271.3M | 0.67 | 3.77 | 0.01 | 0.21 |
Source: Waymo Safety Impact Data Hub, retrieved November 6, 2026.
Where Does Waymo Prevent the Most Injuries? The Injury Avoidance Yield (IAY)
Percent reductions hide something. An 82% cut matters more on streets where humans crash often than on streets where they rarely do. So Axis Intelligence Research built the Injury Avoidance Yield (IAY): the number of injury-reported crashes avoided per million rider-only miles.
IAY = human benchmark any-injury IPMM − Waymo any-injury IPMM
Multiplying each city’s IAY by its rider-only miles gives the injury crashes avoided in that city. The five city results sum to 841.3, matching the 841 fewer injury crashes Waymo reports for all locations, so the formula reconciles with Waymo’s own total.
| City | IAY (injury crashes avoided per million miles) | Implied injury crashes avoided | Share of miles | Share of crashes avoided |
|---|---|---|---|---|
| San Francisco Bay Area | 6.04 | 498 | 30.4% | 59.2% |
| Atlanta | 5.63 | 49 | 3.2% | 5.8% |
| Austin | 2.73 | 58 | 7.8% | 6.8% |
| Los Angeles | 1.63 | 109 | 24.7% | 13.0% |
| Phoenix | 1.39 | 128 | 34.0% | 15.2% |
| All five cities | 3.10 | 841 | 100% | 100% |
Source: Axis Intelligence Research calculation from Waymo Safety Impact Data Hub city rates and miles, data through June 2026. Formula and inputs in the CSV.
According to Axis Intelligence Research, a Waymo mile in San Francisco avoids about 4.3 times as many injury crashes as a Waymo mile in Phoenix (6.04 vs. 1.39). Phoenix logs the most rider-only miles of any city but sits last on IAY, because Phoenix human drivers on Waymo’s roads already crash at a far lower rate (1.95 IPMM) than drivers in San Francisco (6.71).
Liam Michael, Robotics: This is the deployment argument that the headline percentages bury. The safety return on a robotaxi is set by the city’s baseline, not only by the software. Atlanta’s IAY of 5.63 is nearly as high as San Francisco’s on a fraction of the miles, which makes dense, crash-prone Sun Belt cores the highest-yield places to add vehicles. Phoenix proved the system works; San Francisco and Atlanta are where each added mile buys the most safety.
The IAY also has an edge: Atlanta’s figure rests on 8.6 million miles, so its serious-injury rate of 0.00 reflects too few events to rank. We publish the any-injury IAY because it has the most events behind it.
How Many Miles Has Waymo Driven?
Waymo has driven more than 300 million fully autonomous miles, per Alphabet’s Q3 2026 earnings remarks on October 28, 2026. The Safety Impact Data Hub counts 271.3 million rider-only miles through June 2026, up from 127 million through September 2025. That pace works out to about 16.0 million rider-only miles per month between those two readings, an Axis Intelligence Research calculation.
| Milestone | Miles | Source |
|---|---|---|
| Through September 2025 | 127 million | Waymo funding announcement, February 2026 |
| Through June 2026 | 271.3 million | Waymo Safety Impact Data Hub |
| By October 28, 2026 | 300 million+ | Alphabet Q3 2026 earnings remarks |
How Much Does a Waymo Ride Cost?
An average Waymo ride in the San Francisco Bay Area cost $23.24 between March 1 and April 14, 2026, per Obi, a ride-hail price aggregator that compares quotes across apps. That was 18% more than Waymo’s $19.69 average in Obi’s previous sample (November 27, 2025 to January 1, 2026). Waymo does not publish a fare table, so Obi’s figures are estimates from quoted prices, not Waymo data.
Waymo vs. Uber vs. Lyft vs. Tesla Prices (San Francisco Bay Area)
| Service | Average fare, Nov–Dec 2025 | Average fare, Mar–Apr 2026 | Median fare, Mar–Apr 2026 | Price per mile, Nov–Dec 2025 | Price per mile, Mar–Apr 2026 |
|---|---|---|---|---|---|
| Waymo | $19.69 | $23.24 | $20.16 | $9.21 | $9.58 |
| Uber (UberX) | $17.47 | $18.32 | $15.47 | $7.47 | $6.88 |
| Lyft (Standard) | $15.47 | $17.29 | $13.98 | $6.69 | $6.41 |
| Tesla Robotaxi | $8.17 | $11.49 | $10.05 | $3.20 | $4.30 |
Source: Obi, The Cost of Autonomy (January 27, 2026) and Autonomous Rides Are Getting More Expensive: An Update (May 2026), both listed on Obi Research.
According to Axis Intelligence Research, Waymo’s average-fare premium over Uber widened from 12.7% to 26.9% between the two Obi samples, reversing the narrowing Obi had reported in January. Per mile, the gap is wider still: $9.58 for Waymo against $6.88 for Uber, a 39.2% premium. Waymo’s per-mile price rose only 4%, so most of the jump in its average fare comes from longer trips, including rides to SFO that Waymo could not offer in the earlier sample, Obi notes.
One caveat on comparability: the March–April sample keeps only searches where Tesla also returned an offer, so it covers Tesla’s service area rather than all of Waymo’s. Waymo rides take no tip, which narrows the gap a rider actually pays against Uber and Lyft.
Liam Michael, Robotics: Waymo is not discounting its way to a million rides a week. A 39% per-mile premium over UberX, with demand still rising, says riders are paying for the product, and that Waymo’s fleet, not its price, is the binding constraint.
Is Waymo Profitable? Waymo Revenue and Losses
Waymo does not report standalone results. It sits inside Alphabet’s Other Bets segment, whose revenue Alphabet says comes “primarily from the sale of autonomous transportation services and internet services.”
| Quarter | Other Bets revenue | Other Bets operating loss | Source |
|---|---|---|---|
| Q1 2025 | $450M | $(1,226)M | Alphabet Q1 2026 release |
| Q2 2025 | $373M | $(1,246)M | Alphabet Q2 2026 release |
| Q3 2025 | $344M | $(1,426)M | Alphabet Q3 2026 release |
| Q1 2026 | $411M | $(2,100)M | Alphabet Q1 2026 release |
| Q2 2026 | $382M | $(1,799)M | Alphabet Q2 2026 release |
| Q3 2026 | $372M | $(2,047)M | Alphabet Q3 2026 release |
Nine-month Other Bets revenue was $1,165 million in 2026 against $1,167 million in 2025, while the operating loss grew 52.5% to $5,946 million.
Liam Michael, Robotics: Waymo’s weekly rides doubled between April 2025 and April 2026, yet the segment’s revenue line did not move. That tells you Other Bets revenue is not a usable proxy for Waymo fare revenue; the segment mixes several businesses, and Alphabet does not split them out. Any “Waymo revenue” number you read elsewhere is an outside estimate, not a disclosure.
How Much Money Has Waymo Raised?
| Date | Instrument | Amount | Terms | Source |
|---|---|---|---|---|
| February 2, 2026 | Equity | $16 billion | $126 billion post-money; led by Dragoneer, DST Global and Sequoia, with Alphabet as majority investor | Waymo |
| October 8, 2026 | Senior secured term loan (first debt) | $5 billion | Term SOFR + 5.25%, matures October 2032, not guaranteed by Alphabet | Waymo; Alphabet 10-Q |
A lender demanding 5.25 percentage points over the benchmark and taking Waymo’s own assets as security is pricing Waymo as a standalone credit, which is a different signal from an equity mark set largely by its parent.
Where Is Waymo Available?
Waymo serves riders in 15 U.S. metro areas, per its rides page and Alphabet’s October 28, 2026 remarks: Atlanta and Austin (through Uber), plus Dallas, Denver, Houston, Las Vegas, Los Angeles, Miami, Nashville, Orlando, Phoenix, San Antonio, San Diego, the San Francisco Bay Area and Tampa.
Recent changes: San Antonio, San Diego and Tampa opened to all riders on October 14, 2026. Rides to Harry Reid International Airport in Las Vegas began October 21, 2026 within a 24-square-mile service area. On October 27, 2026, Waymo added nearly 250 square miles across Los Angeles, Nashville, Orlando, San Diego and the Bay Area.
Waymo in 2027 and Beyond: International Launch Timeline
| Market | Status (as of November 6, 2026) | Target | Source |
|---|---|---|---|
| London | Listed as “Up Next” | Not dated on Waymo’s rides page | Waymo rides page |
| Tokyo / Japan | Listed as “Up Next”; Toyota bZ4X fleet validation in Japan | 2027 (fleet validation) | Waymo and Toyota |
| Munich, Germany | Mapping and validation driving | Public service toward end of 2027 | Waymo |
| Madrid region, Spain | Validation driving | First riders in 2027 | Waymo |
| Singapore | Vehicles arriving; manual driving in 2027 | Commercial service in 2028 | Waymo |
| Toronto, Canada | Manual driving | First riders in 2028 | Waymo |
Waymo’s rides page also lists 15 U.S. cities as “Up Next,” including Boston, Chicago, New York, Philadelphia, Seattle and Washington, D.C.
How Efficient Is Waymo? California Data Nobody Else Breaks Down
California is the only state that publishes monthly Waymo operating data, through mandatory quarterly reports to the CPUC. Researcher Awad Abdelhalim compiled and published those monthly records in a peer-reviewed Findings paper (May 18, 2026), covering 13.79 million trips and 86.27 million vehicle miles from August 2023 through December 2025. Axis Intelligence Research recomputed the series by year.
| California metric | 2024 | 2025 | December 2025 |
|---|---|---|---|
| Trips completed | 3,075,407 | 10,477,651 | 1,257,187 |
| Share of miles with a passenger aboard | 49.3% | 54.9% | 56.6% |
| Paid miles per trip | 2.91 | 3.50 | 3.79 |
| Passengers per trip | 1.49 | 1.37 | 1.27 |
Source: Axis Intelligence Research calculation from CPUC monthly data published with Abdelhalim (2026), Findings.
Four findings stand out. California trips grew 3.41 times in 2025. California supplied 69.9% of Waymo’s 15 million rides that year. Trips are getting longer, which the paper links to suburban and freeway expansion. And passengers per trip are falling, so shared rides are not taking hold.
Deadheading, the miles a robotaxi drives without a passenger, fell from 51.5% of California miles in January 2024 to 44.3% in September 2025. About 70.1% of those empty miles were spent repositioning or waiting for a request rather than driving to a booked pickup. Empty miles per trip dropped from 5.11 in August 2023 to 2.91 in December 2025.
Liam Michael, Robotics: Uber and Lyft run deadhead above 40% too, per the research the paper cites, so Waymo is not uniquely wasteful. But the passenger-mile share has sat in the mid-50s since mid-2025. Bigger geofences made trips longer without making cars less empty. The next gain has to come from density inside the service area, not from adding square miles.
Waymo Recalls in 2026
| NHTSA campaign | Date | Vehicles | Issue | Interim action |
|---|---|---|---|---|
| 26E026 | May 11, 2026 | 3,791 | Software may drive into standing water on higher-speed roads | Tighter weather limits and map updates, applied by April 20, 2026 |
| 26E035 | June 17, 2026 | 3,871 | Software may enter a closed freeway construction zone at speed | Freeway driving restricted pending a software fix |
Both recalls were remedied by software across the whole affected fleet. Because Waymo owns its vehicles, no owner notification is needed, which lets a fix reach every car at once.
Methodology
Axis Intelligence Research fetched every source on November 6, 2026. Ride counts, cities and miles are company-reported by Waymo or Alphabet. Safety figures come from the Waymo Safety Impact Data Hub, which uses NHTSA SGO crash reports and peer-reviewed benchmark methods (Kusano et al., 2025, Traffic Injury Prevention); Waymo is the producer of these comparisons, which we note because it has an interest in the result, and its data files are public for replication. Financial figures come from Alphabet’s earnings releases and Form 10-Q. Fleet figures come from NHTSA recall acknowledgements. California operating data come from CPUC quarterly reports as compiled in Abdelhalim (2026). Pricing comes from Obi and is labeled as an estimate.
Injury Avoidance Yield (IAY): benchmark any-injury IPMM minus Waymo any-injury IPMM, per city, using Waymo hub figures through June 2026. City crashes avoided equal IAY times city rider-only miles; the sum (841.3) reconciles with Waymo’s reported 841. IAY measures crashes, not people, and inherits the hub’s benchmark choices.
Ride Density Index (RDI): weekly rides divided by fleet proxy, as defined on our robotaxi statistics page. Rides (April 29) and fleet (May 11) are 12 days apart.
California share of rides: CPUC trips completed in 2025 divided by Waymo’s company-reported 15 million rides. CPUC counts and Waymo’s ride count may differ slightly in what they include.
About This Dataset
waymo-statistics.csv contains 195 rows covering Waymo rides, miles, city-level crash rates, IAY and RDI readings, California CPUC operating metrics, Obi fare estimates for two periods (late 2025 and March–April 2026), Alphabet Other Bets financials, funding and launch timelines, from April 2025 to November 2026. Every row carries its source organization, document, URL, retrieval date and whether Axis Intelligence Research calculated it. License: CC BY 4.0. Cite as: Axis Intelligence Research, Waymo Statistics 2026–2027, 2026.
Cite This Page
APA: Axis Intelligence Research, & Michael, L. (2026, November 6). Waymo statistics 2026–2027: Rides, safety by city, fleet and the road to 1 million weekly trips. Axis Intelligence. https://axis-intelligence.com/waymo-statistics/
MLA: Axis Intelligence Research, and Liam Michael. “Waymo Statistics 2026–2027: Rides, Safety by City, Fleet and the Road to 1 Million Weekly Trips.” Axis Intelligence, 6 Nov. 2026, axis-intelligence.com/waymo-statistics/.
Chicago: Axis Intelligence Research and Liam Michael. “Waymo Statistics 2026–2027: Rides, Safety by City, Fleet and the Road to 1 Million Weekly Trips.” Axis Intelligence, November 6, 2026. https://axis-intelligence.com/waymo-statistics/.
Frequently Asked Questions
Will Waymo reach 1 million rides a week by the end of 2026?
Not on disclosed numbers so far. Waymo’s last published count is 500,000 weekly rides (April 29, 2026). At about 132 rides per vehicle per week, Axis Intelligence Research estimates 1 million weekly rides needs roughly 7,600 vehicles, about double the 3,791 in NHTSA’s May 2026 recall filing.
How does Waymo count fatal crashes?
Waymo’s Safety Impact Data Hub does not report fatalities as a separate category, because Waymo says it has not yet driven enough miles to test fatal-crash rates for statistical significance. Fatal crashes are included in its “serious injury or worse” category, where Waymo shows 95% fewer crashes than human drivers through June 2026.
Is a Waymo safer for pedestrians and cyclists?
Waymo reports 93% fewer pedestrian injury crashes and 86% fewer cyclist injury crashes than human drivers over 271.3 million rider-only miles through June 2026. Those figures count all crashes regardless of who was at fault.
Which city has the safest Waymo record relative to local drivers?
On injury crashes avoided per mile, the San Francisco Bay Area leads with an Injury Avoidance Yield of 6.04, followed by Atlanta at 5.63, per Axis Intelligence Research using Waymo hub data. Phoenix ranks last at 1.39 because its human drivers already crash less often on Waymo’s routes.
Does Waymo work on freeways and in snow?
Waymo offered freeway rides in Phoenix, Los Angeles and the San Francisco Bay Area, then restricted freeway driving under NHTSA recall 26E035 in June 2026. Waymo says the 6th-generation Driver in the Ojai is built for snowier cities, but its published safety data covers neither freeways nor snow.
Can I take a Waymo to the airport?
Yes, at several airports. Waymo’s 2025 year in review cites service at Phoenix Sky Harbor and permits for San Francisco and San José airports, and Waymo began rides at Las Vegas’s Harry Reid International Airport on October 21, 2026, with San Antonio International added on October 14.
Is Waymo cheaper than Uber?
No. In Obi’s latest Bay Area sample (March 1 to April 14, 2026), an average Waymo ride cost $23.24, versus $18.32 for Uber, $17.29 for Lyft and $11.49 for Tesla’s Robotaxi. Axis Intelligence Research calculates Waymo’s premium over Uber at 26.9%, up from 12.7% in late 2025. Waymo does not take tips.
Does a person drive the Waymo remotely?
No, according to Waymo. It told Senator Markey in February 2026 that about 70 remote assistance agents are on duty at any time, answering questions from the vehicle’s software without steering it.
Related Axis Intelligence Research Pages
- Robotaxi statistics: Waymo against Baidu Apollo Go and Tesla, and the Ride Density Index
- Self-driving car statistics: L2 versus L4, market size, public trust
- Tesla statistics: Tesla’s robotaxi and FSD figures
- Uber statistics: the human ride-hail baseline Waymo competes with
- Electric vehicle statistics: the EV market Waymo’s all-electric fleet sits in
- Robotics statistics: deployment data across robotics categories