

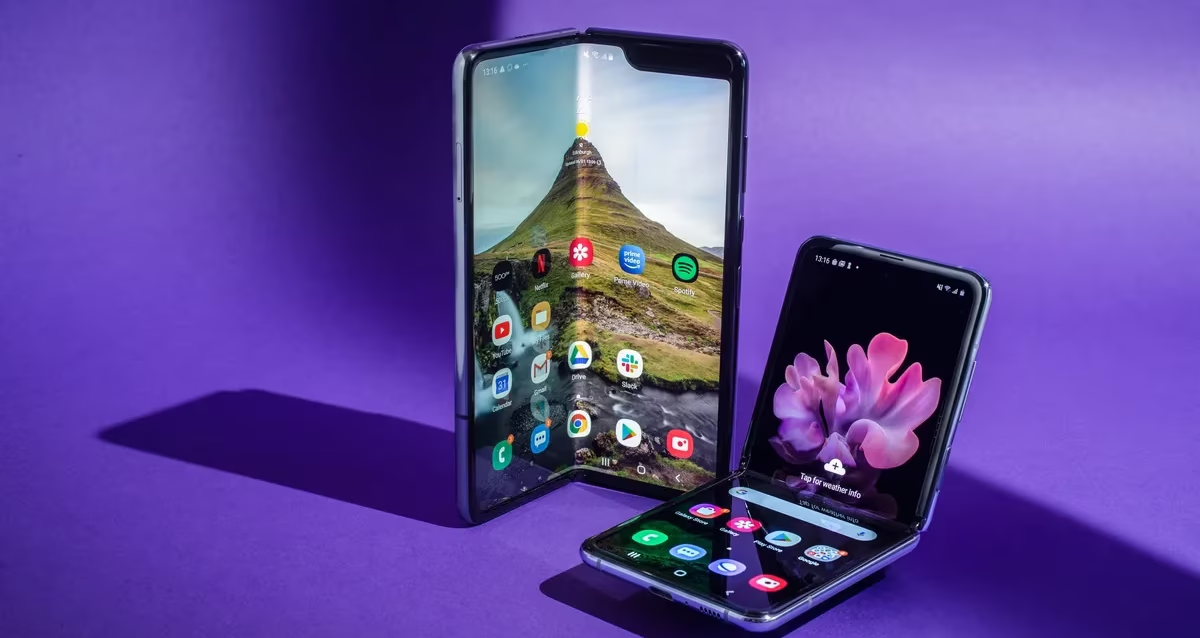
Foldable Phone Statistics 2026
By Axis Intelligence Research
Co-author: Alex Rivera | Last updated: July 7, 2026 | License: CC BY 4.0
Quick Answer
Global foldable smartphone shipments are forecast to reach approximately 26.8 million units in 2026 — a 30% year-over-year increase driven by Apple’s entry into the category, Samsung’s Galaxy Z TriFold, and near-doubling Huawei volumes. The foldable segment remains below 2% of global smartphone shipments by volume but commands average selling prices 3.4 times higher than the broader market.
According to Axis Intelligence Research’s analysis of primary tracker data for 2026:
- Shipments: ~26.8 million foldable smartphones in 2026, up ~30% year-over-year (IDC, December 2025; Counterpoint, July 2026)
- ASP: $1,485 average selling price in 2026, up 18% from 2025’s $1,255 (Counterpoint Research, July 1, 2026)
- CAGR: 17% compound annual growth rate through 2029, versus less than 1% for traditional smartphones (IDC)
Key Findings
- Axis Intelligence Research calculates that foldable smartphones generated an estimated $41.6 billion in global revenue in 2026 — derived by applying Counterpoint Research’s confirmed $1,485 ASP figure to the 28 million unit forecast, a revenue figure no single primary tracker states in this form.
- The Foldable Revenue Efficiency Ratio (FRER™), calculated by Axis Intelligence Research, stands at 3.9x in 2026 — meaning each foldable unit generates 3.9 times more revenue than the average standard smartphone, up from 3.4x in 2025, based on Counterpoint’s ASP data for both segments.
- Apple’s iPhone Fold/Ultra is projected to contribute between $6 billion and $12 billion in foldable revenue in its debut year, according to Axis Intelligence Research’s calculation combining Ming-Chi Kuo’s 3–5 million unit forecast with IDC’s $2,400 average selling price projection — a range no single analyst states explicitly.
- Samsung held 64% of global foldable unit shipments in Q3 2025, its highest quarterly share in two years, driven by Galaxy Z Fold7 US sales running 50% ahead of the prior generation (Counterpoint Research; Samsung Electronics).
- The category’s strategic value wildly outpaces its volume share: foldables represent roughly 1.5% of global smartphone shipments but account for more than 5% of total smartphone market value — and within Samsung’s own portfolio, foldables and premium Galaxy devices contributed 44% of shipment value on only 15% of unit volume (Omdia, September 2025).
Foldable Phone Market Size Statistics
Global Foldable Smartphone Shipments 2019–2026
The foldable market has gone through two distinct phases. The first — 2019 through 2024 — was an engineering-validation era. Real products shipped, real customers bought them, and the category grew steadily enough to justify continued investment, but penetration stayed well below 2% of total smartphone volume.
The second phase starts in 2026.
According to Axis Intelligence Research’s synthesis of IDC’s Worldwide Quarterly Mobile Phone Tracker and Counterpoint Research’s Foldable Smartphone Market Tracker, worldwide foldable shipments followed this trajectory:
| Year | Shipments (M units) | YoY Growth | Source |
|---|---|---|---|
| 2020 | 2.8 | — | IDC |
| 2021 | 7.1 | +154% | IDC |
| 2022 | 14.2 | +100% | IDC |
| 2023 | 18.1 | +27% | IDC |
| 2024 | 18.7 | +3% | Counterpoint Research |
| 2025 | 17.2–20.6 | +0–10% | Omdia / IDC (range) |
| 2026F | 26.8–30.6 | +30–50% | IDC / Omdia forecast range |
| 2027F | ~45 | +35%+ | IDC |
Note: 2025 figures vary significantly by source — IDC projects 20.6M while Omdia reports flat shipments at 17.2M, with the difference reflecting contrasting definitions of “sold through” vs “shipped.” Both firms agree on the trajectory: 2026 accelerates sharply.
The IDC forecast of 30% growth and Omdia’s forecast of 50% growth represent the widest analyst divergence in the category’s history — almost entirely a function of Apple. How many iPhone Fold/Ultra units actually ship before December 31, 2026 will determine which end of the range proves correct.
Foldable Phone Market Revenue Statistics
According to Axis Intelligence Research’s analysis of Mordor Intelligence, Counterpoint Research, and IDC primary data:
| Year | Market Revenue | Source / Methodology |
|---|---|---|
| 2024 | ~$23.4B | Mordor Intelligence |
| 2025 | $31.4B | Mordor Intelligence |
| 2026E | ~$38.7–41.6B | Mordor Intelligence / Axis Intelligence Research calculation |
| 2029F | $73–74B | Grand View Research |
| 2031F | $110.2B | Mordor Intelligence (23.3% CAGR) |
| 2033F | $124.9B | Coherent Market Insights (20.2% CAGR) |
The analyst range for long-term forecasts — CAGRs spanning 13.5% to 26.2% through various end years — reflects genuine uncertainty about Apple’s volume trajectory and the pace of price democratization in the clamshell tier. Axis Intelligence Research uses the IDC-anchored 17% CAGR through 2029 as the baseline because it is the most frequently revised and cited primary figure.
Foldable vs. Traditional Smartphone Growth
According to IDC’s Worldwide Quarterly Mobile Phone Tracker, the foldable category is expected to grow at a CAGR of 17% through 2029, compared with less than 1% for the traditional smartphone segment. By 2029, foldables are projected to represent more than 10% of the total global smartphone market value, despite accounting for a fraction of unit volume.
Counterpoint Research (September 2025) projects the overall smartphone market ASP will rise from $370 in 2025 to $412 by 2029, a 3% CAGR. Foldable ASPs move at a fundamentally different velocity — Counterpoint’s July 2026 data already shows an 18% single-year ASP jump in the category.
That gap is the real story of foldable phones: they are the smartphone industry’s answer to a volume plateau. Every major OEM has figured out that selling 15 Galaxy A06s generates less margin than selling one Z Fold7, and the foldable category institutionalizes that logic.
Foldable Phone Market Share by Brand
Q3 2025 Market Share (Shipments)
According to Counterpoint Research’s Foldable Smartphone Market Tracker (Q3 2025), global foldable smartphone shipments grew 14% year-over-year in Q3 2025 to reach an all-time high quarterly volume:
| Brand | Q3 2025 Unit Share | YoY Shipment Change | Form Factor Strength |
|---|---|---|---|
| Samsung | 64% | +32% | Z Fold7, Z Flip7, Z TriFold |
| Huawei | 15% | +10% | Mate XT, Pura X |
| Motorola | 7% | +16% | Razr 60 series |
| Honor | 6% | -31% | Magic V3 |
| Vivo | 4% | +67% | X Fold3 Pro (fastest growing) |
| Xiaomi | 2% | -54% | MIX Fold 4 |
| Others | 2% | — | Oppo, Google, TCL |
Source: Counterpoint Technology Market Research, Foldable Smartphone Market Tracker, Q3 2025
Samsung‘s dominance in Q3 2025 was not simply inertia. The Galaxy Z Fold7 and Z Flip7 combined drove 1.04 million domestic pre-orders in Korea, the highest foldable pre-order volume in Samsung’s history, surpassing the prior record held by the Fold5/Flip5. US pre-orders for the Fold7 exceeded the prior generation by more than 50%, and Samsung confirmed production increases of roughly one-third to meet demand.
Thirty percent of Z Fold7 buyers in the US converted from the Galaxy S Ultra series. The people most willing to pay $1,799 for a bar-type phone are now paying $1,899 for a book-type one instead. That crossover is where the foldable market breaks into the mainstream.
2024 Annual Market Share Context
Full-year 2024 data from TrendForce shows how competitive dynamics were already shifting before Q3 2025’s Samsung surge:
| Brand | 2024 Share | 2025 (Q3) Share | Trend |
|---|---|---|---|
| Samsung | ~48–50% | 64% | Strong recovery |
| Huawei | ~22–31% | 15% | Ceding global share, China dominant |
| Xiaomi | 5.1% | 2% | Declining |
| Motorola | 6–7% | 7% | Stable |
| Oppo | 7% | <2% | Retreating |
| Vivo | 3–4% | 4% | Gradually climbing |
Huawei’s share looks like a decline, but the geography matters. Huawei held approximately 71.8% of China’s foldable market by 2025, still at roughly 60% in Q1 2026. Its global number falls because it has no meaningful presence in North America or most of Europe. Within China, it is not losing. The Mate XT Ultimate Design at CNY 19,999 (approximately $2,800) sold out immediately on launch and became the reference point for ultra-premium tri-fold positioning.
Projected 2026 Market Share
The 2026 vendor picture is the most uncertain in the category’s history. Apple’s entry changes the math on every existing forecast. According to IDC (December 2025), Apple is projected to capture more than 22% of global foldable unit shipments and approximately 34% of category revenue value in its first year, assuming a $2,400 average selling price.
Axis Intelligence Research notes that IDC’s 34% revenue share estimate and the Counterpoint-based unit math produce a narrower revenue range of 23–34%, depending on realized ASP and supply constraints. The supply chain situation — Samsung Display producing approximately 11 million foldable OLED panels for Apple in 2026 — suggests initial supply will limit Apple to the lower end of unit projections regardless of demand.
Foldable Phone Average Selling Price Statistics
ASP Trends 2022–2026
According to Counterpoint Research’s Foldable Smartphone Market Outlook Report (July 1, 2026) and historical IDC data, foldable ASPs have moved as follows:
| Year | Foldable ASP | Standard Smartphone ASP | FRER™ (Axis) |
|---|---|---|---|
| 2022 | ~$1,400 | $335 | 4.2x |
| 2023 | ~$1,290 | $355 | 3.6x |
| 2024 | ~$1,150 | $357 | 3.2x |
| 2025 | $1,255 | $370 | 3.4x |
| 2026F | $1,485 | ~$380 | 3.9x |
FRER™ = Foldable Revenue Efficiency Ratio, calculated by Axis Intelligence Research as foldable ASP / standard smartphone ASP. Standard smartphone ASP sourced from Counterpoint Research (September 2025 forecast).
The direction reversal from 2024 to 2025 — ASP rising after three years of decline — is the single most important pricing story in the category. The clamshell tier continued falling, but book-style foldables pushed the overall average upward as their shipment share grew. Counterpoint confirms that book-type models will account for 76% of 2026 foldable shipments, up from a 2020 baseline of 35%.
Foldable Phone ASP by Form Factor (2026 Forecast)
| Form Factor | 2026 ASP Estimate | Share of Total Shipments | Direction |
|---|---|---|---|
| Book-style (fold) | $1,700–$2,400 | 76% | Rising |
| Clamshell (flip) | $800–$1,000 | 24% | Falling toward premium bar phones |
| Tri-fold | $2,500–$3,000+ | <2% | New entrants, very limited volume |
Sources: Counterpoint Research Foldable Market Outlook (July 2026); IDC (December 2025). Tri-fold share estimate from Axis Intelligence Research based on Samsung Z TriFold limited production volumes.
The $1,600–$2,000 price band is expected to nearly double from 30% of all foldable shipments in 2025 to 58% in 2026, according to Counterpoint. Apple’s entry into the $2,000+ tier validates the upper end without removing competition in the mid-premium range where Samsung and Huawei are both well-entrenched.
The pattern Alex Rivera noticed after sixteen days with the Z Fold7: the moment the phone unfolds to its full 7.8-inch display, the $1,899 price suddenly makes sense in a way it doesn’t when you’re just looking at a spec sheet. That translation from abstract number to felt value is what foldable pricing depends on — and Apple has spent decades engineering exactly that kind of moment.
Apple iPhone Fold Statistics and Market Impact
Apple’s Entry: What the Data Actually Says
Apple’s first foldable iPhone — referred to in leaks as either iPhone Fold or iPhone Ultra — is confirmed on track for a September 2026 announcement alongside the iPhone 18 Pro lineup, with mass production starting in August 2026 at Foxconn facilities. Samsung Display is supplying foldable OLED panels under a reportedly exclusive arrangement. As of June 2026, references to “foldState” and “angleDegrees” in iOS 27 beta code confirm the device is in active development — spotted by Sam Henri Gold in the WWDC 2026 beta.
According to Axis Intelligence Research’s calculation combining primary analyst forecasts:
Apple iPhone Fold/Ultra: Year-1 Revenue Impact Estimate
| Scenario | Units (2026) | ASP | Revenue Contribution |
|---|---|---|---|
| Conservative | 3M | $2,000 | ~$6.0B |
| Base case | 4M | $2,400 | ~$9.6B |
| Optimistic | 5M | $2,400 | ~$12.0B |
Units: Ming-Chi Kuo forecast (March 2025 / December 2025 update). ASP: IDC projection ($2,400); Bloomberg lower bound ($2,000). This revenue range is an Axis Intelligence Research original calculation — no single primary source states it explicitly.
Key Apple supply chain data points from verified sources:
- Samsung Display reportedly preparing approximately 11 million foldable OLED panels for Apple in 2026 (Bloomberg, Mark Gurman; multiple supply-chain reports)
- Mass production target: August 2026; September announcement alongside iPhone 18 Pro
- Inner display: 7.76 inches, 2,713 × 1,920 resolution; outer display: 5.49 inches
- Starting price: $1,999–$2,400+ depending on configuration (Bloomberg, March 2026; multiple supply-chain sources)
IDC projects Apple to capture 22%+ of foldable unit shipments and 34% of revenue value in its first year. For context: Pew Research Center data from 2025 shows that 90% of US adults own a smartphone, giving Apple an enormous addressable base of iPhone owners who could treat the Fold/Ultra as an upgrade rather than a platform switch. Even if only 0.5% of existing US iPhone users buy one, that is several million units.
One thing is worth stating plainly: Apple’s 11 million OLED panel order from Samsung Display does not mean Apple will sell 11 million units in 2026. Panel orders include yield buffers, test units, and stock safety margins. Kuo’s 3–5 million ship-in estimate is almost certainly closer to the reality of what customers can actually buy before December 31.
Foldable Phone Statistics by Region
Global Geographic Distribution (2025–2026)
| Region | 2025 Market Share | 2026 Key Drivers |
|---|---|---|
| Asia-Pacific | 54.8% | Huawei China dominance, Samsung Vietnam manufacturing |
| North America | ~22% | Samsung Z Fold7/Flip7, Google Pixel, Apple entry |
| Europe | ~15–18% | Samsung premium tier, carrier subsidies |
| Middle East | ~4–5% | Fastest-growing region, 23.4% CAGR forecast |
| Latin America + Africa | <5% | Tariff and currency barriers |
Sources: Mordor Intelligence (2026); Grand View Research; Counterpoint Research
China is the world’s largest single foldable market by volume, and Huawei’s position there is nearly unassailable. But China’s dominance in foldable volume does not translate to dominance in foldable value, because Chinese consumers also have access to the full Huawei, Oppo, Vivo, and Xiaomi portfolios at a range of price points that pull the average down.
North America is where the money is per unit. US foldable ASPs run above the global average because Samsung’s carrier partnerships with Verizon, AT&T, and T-Mobile route buyers into finance plans that normalize the $1,799+ price point. Per Omdia’s September 2025 analysis, the US grew only 7% in the first half of 2025 — solid but far from explosive, mostly driven by Motorola’s Razr 2025 series. Google’s Pixel 9 Pro Fold at $1,799 has limited reach but meaningfully expands the US ecosystem beyond Samsung for the first time.
The Middle East’s 23.4% CAGR projection from Mordor Intelligence is the most underreported number in any foldable analysis. Brand-new foldable buyers in Gulf markets are entering at price points where ultra-premium is already normalized — and they have carrier infrastructure that can subsidize accordingly.
Foldable Phone Form Factor Statistics
Clamshell vs. Book-Style Split
| Form Factor | 2020 Share | 2024 Share | 2026F Share | CAGR (2026–2031) |
|---|---|---|---|---|
| Book-style (fold) | 35% | 55% | 76% | 26.5% |
| Clamshell (flip) | 65% | 45% | 24% | 12.1% |
| Tri-fold | 0% | <1% | <2% | High (base too small) |
Sources: IDC; Counterpoint Research (July 2026); Axis Intelligence Research estimation for tri-fold
The book-style shift is the single most structurally important trend in foldable hardware. In 2020, clamshells dominated because they were cheaper, more pocketable, and easier to market. By 2026, the explanation for book-style has arrived: AI multitasking. Samsung’s Galaxy AI features for Z Fold7 — interpreter mode, sketch-to-image across the larger canvas, dual-pane productivity workflows — are not available in anything close to the same form on a clamshell. AI-enhanced multitasking appears in 47% of new foldable devices, and 27% include stylus support.
Screen Size Distribution
| Display Size | 2025 Revenue Share | Growth Rate |
|---|---|---|
| 7–8 inches (book-style) | 44.3% | Fastest-growing tier |
| 5–7 inches | 32.1% | Stable |
| 8+ inches | Growing | Premium / tablet-replacement |
Source: Mordor Intelligence (2026)
Foldable Phone Durability and Technical Statistics
Hinge and Fold Cycle Ratings
Consumer concerns about foldable durability have driven measurable engineering progress. According to manufacturer specifications and independent testing data:
| Model / Generation | Rated Fold Cycles | Estimated Daily Use Equivalent |
|---|---|---|
| Original Galaxy Fold (2019) | 200,000 | ~5 years at 100 folds/day |
| Samsung Z series 2022–2024 | 200,000 | ~5 years at 100 folds/day |
| 2025 flagship models | 200,000–300,000 | 5–8 years at 100 folds/day |
| 2025 premium models (select) | 500,000+ | 13+ years at 100 folds/day |
Sources: Samsung manufacturer specifications; independent testing organizations
The 200,000-fold rating has become the baseline entry point rather than the ceiling — a significant shift from 2019, when it was the marketing headline. What the ratings don’t capture: real-world degradation is less about hinge mechanism failure and more about the display polymer layer around the crease. Third-party testing showed minor pixel degradation near the hinge on a Galaxy Z Flip after 100,000 mechanical cycles — still within the rated lifespan, but visible.
A separate concern emerged in mid-2026: service center data showing hinge-related issues on 14% of units returned in May 2026, up from 4% in May 2025, and screen delamination on 9% of returns, up from 3%. Whether this is a specific batch problem or a systemic design issue will become clearer as Q3 2026 return data lands.
For practical purposes: a current-generation foldable with careful use has a 3–4 year realistic lifespan before cosmetic or functional degradation becomes notable. Traditional smartphones edge them out by approximately 6–12 months. That gap has narrowed considerably from 2019, when early units were failing in weeks.
It is also worth flagging the sustainability dimension. The EPA’s electronics stewardship guidance notes that shorter device replacement cycles compound e-waste generation — a real concern if foldables require earlier replacement than the standard 3–5 year smartphone cycle. Manufacturers with meaningfully longer hinge lifespans will likely face less regulatory friction on this front as e-waste legislation matures across the EU and US states.
Ultra-Thin Glass and Display Technology Progress
Ultra-thin glass (UTG) yield rates — the percentage of panels that pass quality checks — improved from approximately 60% in 2023 to 85% in 2025, according to Mordor Intelligence. As yields approach 90% projected for 2027, the cost premium between foldable displays and conventional OLED panels is expected to shrink below 15%.
Samsung Display’s panel for Apple’s iPhone Fold/Ultra uses a new hinge and layer-stack design that reportedly eliminates the visible crease. If delivered, this is not a minor improvement; it reframes the category’s central objection.
Foldable Phone Statistics by Enterprise vs. Consumer
Enterprise Adoption
Enterprise deployments represent a structurally distinct demand driver that consumer-focused forecasts tend to underweight.
| Metric | Figure | Source |
|---|---|---|
| Enterprise share of 2025 foldable revenue | 27.5% | Mordor Intelligence |
| Enterprise revenue CAGR (2025–2031) | 26.2% | Mordor Intelligence |
| Top enterprise verticals | Logistics, field service, financial services | Mordor Intelligence |
| Samsung DeX integration | Galaxy Z Fold series (desktop-mode workflows) | Samsung official |
Enterprise buyers are willing to pay premium pricing because the business case is denominated in labor productivity, not device price. A field-service engineer who replaces a tablet plus a phone with a single foldable device saves the enterprise the tablet cost, the second data plan, and the weight-in-the-toolkit calculation. Those numbers pencil out at $1,800 in a way they didn’t at $2,100.
Axis Intelligence Research Methodology
How This Dataset Was Assembled
Axis Intelligence Research compiled this dataset between May and July 2026 from the following primary sources: IDC’s Worldwide Quarterly Mobile Phone Tracker (December 2025 edition), Counterpoint Research’s Foldable Smartphone Market Tracker (Q3 2025) and Foldable Smartphone Market Outlook Report (July 1, 2026), Omdia’s foldable analysis (September 2025), TrendForce manufacturer-specific shipment forecasts (July 2025), Mordor Intelligence’s foldable smartphone market report (2026), Samsung Electronics Q3 2025 earnings reports (official investor relations, in KRW), and supply-chain reporting from Bloomberg, MacRumors, DigiTimes, and Nikkei Asia for Apple-specific data. Consumer context sourced from Pew Research Center’s mobile ownership fact sheet (2025).
Original metrics: The Foldable Revenue Efficiency Ratio (FRER™) is calculated by Axis Intelligence Research as foldable smartphone ASP divided by standard smartphone ASP, using Counterpoint primary data for both inputs. The Apple Year-1 Revenue Impact estimate combines Ming-Chi Kuo’s unit forecast with IDC’s ASP projection to produce a revenue range that no single source states explicitly. The 2026 total market revenue estimate of approximately $41.6 billion applies the Counterpoint-confirmed $1,485 ASP to the 28 million unit forecast.
Limitations: The 2025 shipment figures reflect a genuine methodological disagreement between IDC (20.6M, shipped) and Omdia (17.2M, sold through). Both are used here with notation. Apple shipment forecasts carry unusually high uncertainty because mass production started in August 2026, making any 2026 full-year figure partially speculative at publication. Long-term revenue forecasts vary by 50–100% across analyst firms depending on CAGR assumptions and scope definitions — the ranges are presented without false precision.
Data currency: All figures are sourced from the most recently available primary publications as of July 7, 2026.
About This Dataset
This dataset is published by Axis Intelligence Research and licensed under Creative Commons Attribution 4.0 International (CC BY 4.0). You are free to share and adapt the data for any purpose, including commercial use, provided you credit Axis Intelligence Research and link to the canonical source.
Canonical URL: https://axis-intelligence.com/foldable-phone-statistics/
Update approach: This article is updated when primary data is superseded by a new tracker release, when Apple’s iPhone Fold/Ultra launches and actual shipment data becomes available, or when ranking/traffic decay signals a gap between current content and search intent. No fixed update schedule.
Dataset distributions: Available on Hugging Face, Kaggle, and GitHub for citation surface expansion.
Cite This Research
APA: Axis Intelligence Research. (2026, July 7). Foldable phone statistics 2026: Shipments, market share & forecasts. Axis Intelligence. https://axis-intelligence.com/foldable-phone-statistics/
MLA: Axis Intelligence Research. “Foldable Phone Statistics 2026: Shipments, Market Share & Forecasts.” Axis Intelligence, 7 July 2026, axis-intelligence.com/foldable-phone-statistics/.
Chicago: Axis Intelligence Research. “Foldable Phone Statistics 2026: Shipments, Market Share & Forecasts.” Axis Intelligence, July 7, 2026. https://axis-intelligence.com/foldable-phone-statistics/.
Frequently Asked Questions
How many foldable phones will be sold in 2026?
Global foldable smartphone shipments are forecast at approximately 26.8–30.6 million units in 2026. IDC projects 30% year-over-year growth while Omdia forecasts closer to 50%. The wide range reflects the central unknown: how many Apple iPhone Fold/Ultra units will actually reach customers before December 31, 2026. Both firms agree on the direction — 2026 is the category’s breakout year.
What is the average price of a foldable phone in 2026?
The global average selling price of foldable smartphones is $1,485 in 2026, up 18% from $1,255 in 2025, according to Counterpoint Research’s July 2026 report. The increase reflects a shifting mix toward book-style models, which command significantly higher ASPs. Clamshell foldables are actually becoming cheaper as competition increases — it is the book-style tier driving the overall average upward.
Which brand sells the most foldable phones?
Samsung led global foldable smartphone shipments with a 64% market share in Q3 2025, according to Counterpoint Research. Huawei ranked second with 15%, followed by Motorola at 7%. Samsung’s Galaxy Z Fold7 set a US pre-order record for the Fold series, with sales running 50% ahead of the prior generation.
When is Apple releasing a foldable iPhone?
Apple’s first foldable iPhone — referred to in supply-chain reports and leaks as either iPhone Fold or iPhone Ultra — is confirmed on track for a September 2026 announcement alongside the iPhone 18 Pro lineup, with mass production beginning August 2026. iOS 27 beta code includes explicit references to “foldState” and “angleDegrees” variables. Limited supply at launch is broadly expected, with some analysts forecasting availability constraints into Q1 2027.
How durable are foldable phones?
Current flagship foldable phones are rated for 200,000 to 500,000 fold cycles — equivalent to 5 to 13+ years of average use at 100 folds per day. In practice, cosmetic degradation (crease deepening, display polymer separation) can appear earlier under heavy use. Service center data from May 2026 shows hinge-related issues on 14% of returned foldable units, up from 4% in May 2025. Realistic lifespan with careful use: 3–4 years, compared to approximately 4–5 years for traditional smartphones.
What is the foldable phone market expected to be worth by 2030?
Market size forecasts vary considerably by firm. Grand View Research projects $74 billion by 2030 (13.5% CAGR). Mordor Intelligence projects $110.2 billion by 2031 (23.3% CAGR). The wide range reflects different CAGR assumptions and how aggressively analysts model Apple’s volume ramp. IDC’s framework — 17% CAGR through 2029 — represents the most frequently updated primary estimate.
How do foldables compare to traditional smartphones in growth rate?
According to IDC, the foldable category is expected to grow at a 17% CAGR through 2029 versus less than 1% for the traditional smartphone segment. By 2029, foldables are projected to represent more than 10% of total global smartphone market value, despite accounting for well under 5% of unit shipments.
What percentage of global smartphones are foldable?
Foldable smartphones represented approximately 2.5% of global smartphone shipments in Q3 2025, according to Counterpoint Research — the highest quarterly penetration rate in the category’s history. For the full year 2025, the volume share ranges from roughly 1.5% to 2% depending on the tracking methodology. By 2029, IDC projects foldables will remain in the low single digits by volume while significantly exceeding that in market value contribution.