

Reusable Rocket Statistics 2026
By Axis Intelligence Research
Co-author: Steven Smith (Space Economy) | Last updated: August 19, 2026 | License: CC BY 4.0
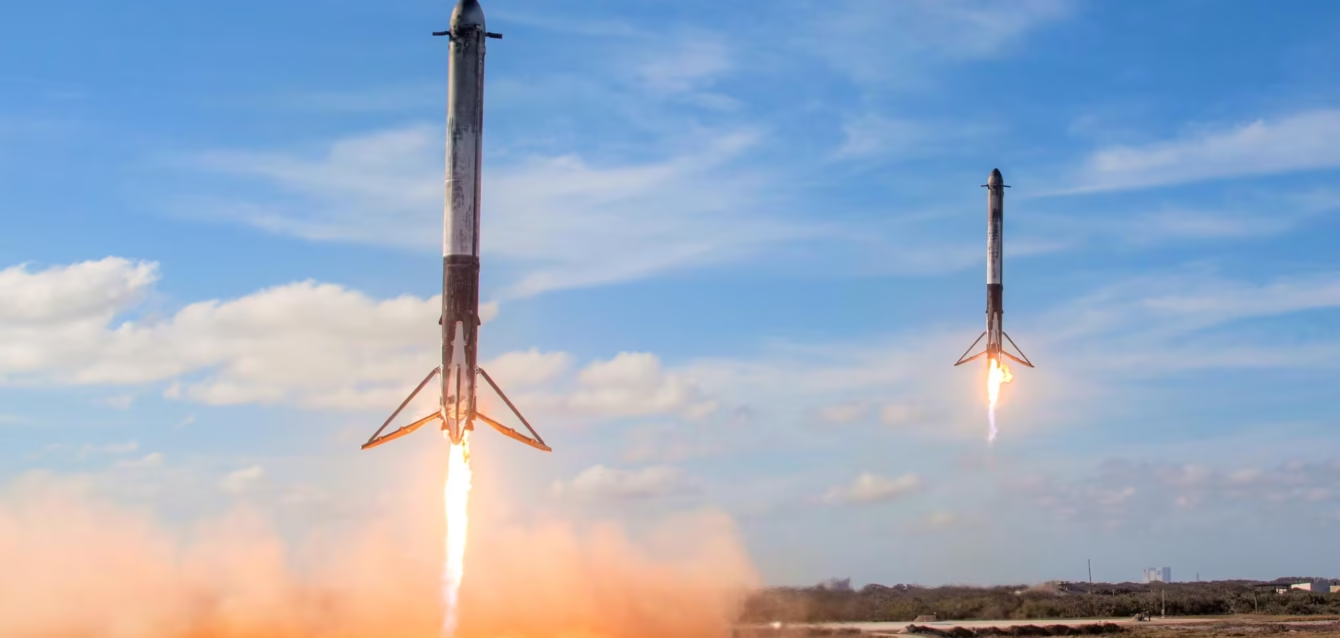
A single Falcon 9 first stage had flown 34 times as of March 31, 2026, and more than 540 of SpaceX’s roughly 650 orbital launches had used a flight-proven booster. Axis Intelligence Research finds that 92.3% of the cost benefit of reusing that booster was already banked by its tenth flight. The record-setting flights are cadence, not savings.
Quick Answer
Reusable rockets now carry the overwhelming majority of the world’s payload to orbit. SpaceX’s Falcon 9 has demonstrated 34 reflights of a single first stage, and Axis Intelligence Research calculates a Flight-Proven Share (FPS) of at least 83.1% across SpaceX’s launch history. The global average cost to send a kilogram to orbit fell to $3,868 in 2025, down 95.56% from 1960. But Axis Intelligence Research’s Booster Flight Amortization (BFA) curve shows the economics saturate early: flights eleven through forty of a booster’s life deliver just 7.7% of the total amortization benefit.
Key Findings
- Axis Intelligence Research calculates a Flight-Proven Share of at least 83.1% for SpaceX orbital launches, from the company’s disclosure of over 540 flight-proven flights out of approximately 650 total as of March 31, 2026.
- Axis Intelligence Research finds that a booster’s second flight captures 51.3% of the total amortization benefit available across a 40-flight design life, and its tenth flight captures 92.3%.
- Axis Intelligence Research calculates that the first reflight of a booster is worth 630 times more per-flight build-cost reduction than the thirty-sixth reflight.
- According to the FAA’s Aerospace Forecast for fiscal years 2026 to 2046, six operators conducted 195 licensed launches in FY2025, of which SpaceX flew 161 — the highest annual total in U.S. history.
- According to Terzi and Nicoli in PNAS Nexus, the average cost of sending one kilogram to orbit fell from $87,023 in 1960 to $3,868 in 2025, declining 21.2% for every doubling of cumulative payload.
How Many Times Has a Rocket Booster Been Reused?
The verified ceiling comes from a filing, not a press release. In its Form S-1 registration statement filed with the SEC on May 20, 2026, SpaceX states that as of March 31, 2026, its Falcon 9 rockets have demonstrated the ability to refly a first stage 34 times.
That same filing supplies the aggregate that matters more than the record. SpaceX reports approximately 650 completed orbital space launches, of which over 540 were flown by a flight-proven Falcon rocket. Falcon 9 alone accounts for roughly 620 of those launches at an above-99% mission success rate, with Falcon Heavy contributing 11 flights at 100%.
Trade coverage since the filing has reported the fleet leader passing 36 flights in July 2026, and Spaceflight Now has reported a company qualification target of 40 flights per first stage. Neither figure appears in a primary filing yet. We use 34 as the verified maximum and treat 40 as a stated target, because the difference between a demonstrated number and an intended one is the whole subject of this article.
Reuse Milestones by Vehicle
| Vehicle | Operator | Demonstrated reflights of one stage | Stated design target | Source |
|---|---|---|---|---|
| Falcon 9 | SpaceX | 34 (as of 2026-03-31) | 40 flights (trade-reported) | SpaceX Form S-1, sec.gov |
| New Glenn | Blue Origin | 1 booster landing (Nov 2025) | 25 missions, goal of 100 | FAA Aerospace Forecast, faa.gov |
| Starship | SpaceX | 11 flight tests, no orbital payload delivery | Up to 100 flights | SpaceX Form S-1; FAA Aerospace Forecast |
| Terran R | Relativity Space | 0 (first launch not before late 2026) | ~20 reuses | FAA Aerospace Forecast, faa.gov |
| Neutron | Rocket Lab | 0 (in development) | Reusable-ready, 13,000 kg to LEO | Rocket Lab Form 10-Q, sec.gov |
| Zhuque-3 | LandSpace | 0 (recovery failed on maiden flight) | No fewer than 20 | LandSpace statements via Xinhua |
Steven Smith: The column that does the work here is not the record — it is the gap between column three and column four. Four of the six vehicles have a design target and zero demonstrated reflights. That is not a criticism of the engineering; it is a statement about where the industry actually is. One operator has a reuse program. Everyone else has a reuse plan, and a plan has never turned a pad around.
What Does Each Additional Booster Flight Actually Save?
This is where the reporting usually stops and the arithmetic should start.
When a first stage is expended, its entire build cost is charged against one mission. When it flies twice, each mission carries half. Axis Intelligence Research formalizes this as Booster Flight Amortization (BFA) — the share of a first stage’s build cost charged to each individual flight after N flights.
BFA(N) = 100 / N, expressed as a percentage of the stage’s original build cost.
The formula is deliberately trivial. Its consequences are not.
The Booster Flight Amortization Curve
| Flights completed (N) | BFA — build cost charged per flight | Marginal gain vs. previous flight | Cumulative share of benefit captured |
|---|---|---|---|
| 1 | 100.0% | — | 0.0% |
| 2 | 50.0% | 50.000 pp | 51.3% |
| 3 | 33.3% | 16.667 pp | 68.4% |
| 5 | 20.0% | 5.000 pp | 82.1% |
| 10 | 10.0% | 1.111 pp | 92.3% |
| 15 | 6.7% | — | 95.7% |
| 20 | 5.0% | 0.263 pp | 97.4% |
| 25 | 4.0% | 0.167 pp | 98.5% |
| 34 | 2.941% | 0.089 pp | 99.5% |
| 40 | 2.5% | 0.064 pp | 100.0% |
Source: Axis Intelligence Research calculation. Capture denominator is the benefit available between flight 1 and a 40-flight design life. Demonstrated maximum of 34 flights from SpaceX Form S-1 (sec.gov).
Three findings fall out of that table.
The first reflight is the entire ballgame. Moving a stage from one flight to two removes 50 percentage points of build cost from every mission. Moving it from 35 flights to 36 removes 0.079 percentage points. Axis Intelligence Research calculates the ratio at 630 to 1.
The curve is functionally flat by flight ten. A booster that flies ten times has captured 92.3% of everything reuse can give it under a 40-flight life. The remaining thirty flights split 7.7% between them.
The finding survives the assumption. We tested the capture ratio against design lives from 25 to 100 flights. At a 25-flight ceiling, flight ten captures 93.8%. At 100 flights, it captures 90.9%. Whatever SpaceX or Blue Origin eventually certify their hardware for, the shape does not move.
Steven Smith: So why chase flight 36? Because per-flight build cost stopped being the binding constraint a long time ago. What a deep booster fleet buys is not cheapness — it is availability. A stage cleared for its thirtieth flight is a stage that does not need to be built, and manufacturing throughput, not amortization, is what caps cadence. The record flights are a fleet-size story wearing an accounting costume. When a manifest calls for 161 launches and your factory builds twelve stages a year, the number that saves you is the one on the tail you already own.
The corollary is uncomfortable for new entrants. A competitor that reaches five reflights per booster has already captured 82.1% of the amortization benefit SpaceX gets at 34. The remaining advantage is real, but it is small, and it is not where the moat is. The moat is in refurbishment cycle time, drone-ship logistics, and pad turnaround — none of which appear on a reuse-count leaderboard.
What Is the Cost per Kilogram to Orbit in 2026?
Two rigorous sources answer this question and they do not agree, because they are not measuring the same thing.
The peer-reviewed answer comes from Alessio Terzi and Francesco Nicoli, writing in PNAS Nexus in July 2026. They assembled 4,405 launches spanning 1960 to 2025 and more than 330 rocket configurations, standardized every mission to low Earth orbit in 2024 dollars, and found the global average cost per kilogram fell from $87,023 in 1960 to $3,868 in 2025.
The single-vehicle answer comes from NASA. In The Recent Large Reduction in Space Launch Cost, Harry W. Jones of NASA Ames calculated that the Space Shuttle cost about $1.5 billion to lift 27,500 kg to LEO — $54,500 per kilogram — against Falcon 9’s advertised $62 million for 22,800 kg, or $2,720 per kilogram. A factor of twenty.
Cost per Kilogram to Low Earth Orbit, by Construction
| Measure | Value | As of | Construction | Source |
|---|---|---|---|---|
| Global fleet average | $3,868/kg | 2025 | Unit flyaway cost, 4,405 launches, standardized to LEO, 2024 USD | PNAS Nexus |
| Global fleet average | $87,023/kg | 1960 | Same methodology | PNAS Nexus |
| Falcon 9 benchmark | $2,720/kg | 2018 | Advertised list price ÷ expendable LEO capacity | NASA, ntrs.nasa.gov |
| Space Shuttle | $54,500/kg | 2018 | Program cost ÷ LEO capacity | NASA, ntrs.nasa.gov |
| Falcon 9 + Dragon to ISS | $23,300/kg | 2018 | Mission cost ÷ delivered payload | NASA, ntrs.nasa.gov |
| Pre-Falcon historical average | $18,500/kg | 2026 | Cited by SpaceX, attributed to NASA | SpaceX Form S-1, sec.gov |
| Starship at entry to service | ~$1,000/kg | 2026 est. | Author estimate, conditional on full reusability | PNAS Nexus |
| New Glenn at entry to service | ~$1,500/kg | 2026 est. | Author estimate | PNAS Nexus |
Axis Intelligence Research calculates that the 2025 global fleet average sits 42.2% above the Falcon 9 benchmark NASA computed seven years earlier. We are publishing these two figures side by side and declining to merge them into a single headline number. One is a list price divided by a brochure payload capacity for one vehicle; the other is a unit flyaway cost averaged across every launcher humanity flew, including expendable Russian, Chinese, Indian and European hardware. Averaging them would produce a figure that means nothing.
The gap is itself the finding. The cheapest vehicle in the world got dramatically cheaper. The world’s average did not follow it down as fast, because most payload does not fly on the cheapest vehicle — it flies on whatever a national program, a launch contract, or a strategic-autonomy policy specifies.
Is Reuse Actually What Made Launch Cheap?
Not by itself, and the PNAS Nexus decomposition is unusually precise about this.
The paper reports a headline experience curve of 21.2% cost reduction for every doubling of cumulative payload to orbit — steeper than solar photovoltaics at 20.2% per doubling and steeper than transatlantic steamship freight at 15.5%. Model fit since 2000 is strong, with an R² of 0.953.
But the authors separate that aggregate into two mechanisms. Learning within a rocket family — genuine engineering improvement on the same hardware, which is where reuse lives — runs at roughly 6% per doubling, rising to 8% after the Cold War. The rest is reallocation: payload moving off expensive launchers onto cheap ones.
Axis Intelligence Research calculates that within-family learning accounts for 28.3% of the aggregate per-doubling decline, and reallocation for 71.7%.
What Drove the Cost Decline, by Era
| Period | Cost decline per doubling of payload | Dominant mechanism | Source |
|---|---|---|---|
| Pre-1989 (Cold War) | ~17% | Reallocation only; within-family costs rose | PNAS Nexus |
| Post-1989 | ~44% | Both learning and reallocation | PNAS Nexus |
| Within-family learning, all years | ~6% | Engineering improvement on fixed designs | PNAS Nexus |
| Within-family learning, post-Cold War | ~8% | Engineering improvement, accelerated | PNAS Nexus |
Steven Smith: Read that decomposition carefully, because it inverts the popular story. Reuse did not primarily make rockets cheaper by making a Falcon 9 cheaper than a Falcon 9 used to be. It made rockets cheaper by making Falcon 9 so much cheaper than everything else that the world’s payload migrated onto it. The structural break test in the paper lands on 2010 — the year Falcon 9 first flew, on the back of NASA’s COTS program — with a p-value of zero to three decimals. The vehicle mattered enormously. It just mattered through market share, not through the depreciation schedule.
Which sets up the risk the authors name explicitly. If reallocation drives the curve, and reallocation now means concentration on one American provider handling roughly 75% of global payload, then geopolitics can stall the curve without a single engineering setback. Governments buying strategic autonomy will buy more expensive domestic launches. That is reallocation running backwards.
Who Is Actually Flying Reusable Rockets?
The regulator’s ledger is the least flattering and most reliable answer. The FAA Aerospace Forecast for fiscal years 2026 to 2046 records 982 licensed launches and reentries between 1989 and 2025 — and 603 of those, roughly 61.0%, occurred in the five years from 2021 to 2025.
FY2025 set the U.S. record at 204 licensed operations: 195 launches and 9 reentries.
FAA-Licensed Launches by Operator, FY2025
| Operator | Licensed launches | Share of 195 | Reusability status |
|---|---|---|---|
| SpaceX | 161 | 82.6% | Operational booster reuse |
| Rocket Lab | 15 | 7.7% | Recovery development; Neutron in build |
| Blue Origin | 10 | 5.1% | One New Glenn booster landing |
| United Launch Alliance | 4 | 2.1% | Expendable |
| Stratolaunch | 4 | 2.1% | Reusable carrier aircraft |
| Firefly Aerospace | 1 | 0.5% | Expendable |
Source: FAA Aerospace Forecast FY2026–2046 (faa.gov). Share column calculated by Axis Intelligence Research.
One note on that table. The FAA’s narrative states SpaceX accounted for 83.0% of licensed launches; recomputing 161 ÷ 195 from the agency’s own figures gives 82.56%. The difference is immaterial to any conclusion, but we flag it because our arithmetic should be checkable against the source, and this is what checking it produces.
Where Those Launches Happened
| Site | FY2025 licensed launches | Source |
|---|---|---|
| Cape Canaveral, Florida | 76 | FAA, faa.gov |
| Vandenberg Space Force Base, California | 61 | FAA, faa.gov |
| Kennedy Space Center, Florida | 26 | FAA, faa.gov |
| Mahia, New Zealand | 15 | FAA, faa.gov |
| All other sites | 17 | FAA, faa.gov |
More than 68.0% of FY2025 missions involved satellite constellation deployment. Eight licensed operations resulted in a mishap.
How Fast Is Reusable Launch Capacity Growing?
The FAA publishes a bounded forecast rather than a point estimate, which is the correct instinct for a sector this volatile. Under the high case, authorized operations rise from 214 in FY2026 to 507 in FY2036. Under the low case, 209 to 282.
The agency attributes the low-case upgrade from last year’s forecast directly to routine rocket landings, sustained mission success, and declining launch costs — while cutting the high case by 545 operations over FY2026–2034, citing slower Mars work, a provider’s pivot to missile defense, and Blue Origin’s pause of New Shepard.
Reusable Heavy-Lift Vehicles: Payload and Design Life
| Vehicle | LEO payload, reusable config. | Design reuse target | Status | Source |
|---|---|---|---|---|
| Starship | 150 t (FAA); 100 t (SpaceX, V3) | Up to 100 flights | 11 flight tests; payload delivery expected H2 2026 | FAA, faa.gov; SpaceX S-1, sec.gov |
| New Glenn | 45 t | ≥25 missions, goal 100 | 1 booster landing (Nov 2025) | FAA, faa.gov |
| Terran R | 24 t | ~20 reuses | First launch not before late 2026 | FAA, faa.gov |
| Neutron | 13,000 kg | Reusable-ready | In development | Rocket Lab 10-Q, sec.gov |
| Atlas V (reference) | 18.9 t expendable | None | Expendable | FAA, faa.gov |
Rocket Lab’s Form 10-Q for the quarter ended March 31, 2026 describes Neutron as reusable-ready with approximately 13,000 kg to LEO in reusable configuration, and characterizes Electron recovery as a potential ability providing a path to reusability. That is careful drafting, and it is the honest state of the program.
China’s entry is Zhuque-3. LandSpace flew it for the first time on December 3, 2025; the second stage reached orbit, and the first stage suffered anomalous combustion during the landing burn and did not touch down. Per company statements relayed by Xinhua, LandSpace planned a further recovery attempt in the second quarter of 2026 and targets a first recovery-and-reflight mission in the fourth quarter. Design plans call for no fewer than 20 reuses, and the stated commercial goal is cutting Chinese launch cost from roughly 100,000 yuan per kilogram to about 20,000.
Steven Smith: Announced dates and flown dates are different quantities, and a program’s schedule history predicts its next schedule better than its press release does. Zhuque-3’s manifest has already slipped once. New Glenn’s third flight was scheduled for late February 2026 after a November 2025 landing. Starship has eleven flight tests and no orbital payload delivery, against $3.004 billion in Space-segment R&D in 2025 alone — which Axis Intelligence Research calculates at 73.5% of that segment’s $4.086 billion in revenue for the year. Full reusability is being paid for out of the partial reusability that already works. Show me the reflown hardware and I will move the numbers.
Methodology
Collection. Axis Intelligence Research assembled this dataset between August 17 and August 18, 2026, from five primary sources fetched and read in full during production: SpaceX’s Form S-1 registration statement filed with the SEC on May 20, 2026; Rocket Lab’s Form 10-Q for the quarter ended March 31, 2026; the FAA’s Aerospace Forecast for fiscal years 2026–2046, Commercial Space section; NASA technical report ARC-E-DAA-TN56851 via the NASA Technical Reports Server; and Terzi and Nicoli, From Sputnik to Starship, PNAS Nexus, volume 5 issue 7, DOI 10.1093/pnasnexus/pgag217, published July 14, 2026. Every figure in this article traces to a row in the accompanying CSV carrying its source organization, document, URL and retrieval date.
Booster Flight Amortization (BFA). BFA(N) = 100 ÷ N, the share of a first stage’s original build cost charged to each flight after N flights. Marginal gain from flight N to N+1 is BFA(N) − BFA(N+1), in percentage points. Cumulative capture at flight N is [BFA(1) − BFA(N)] ÷ [BFA(1) − BFA(L)], where L is the assumed design life; we set L = 40 to match the qualification target reported for Falcon 9. All values were computed twice using independent implementations, and the capture ratio was stress-tested across L values of 25, 30, 36, 40, 50 and 100 flights. BFA measures the amortization of first-stage build cost only. It does not model refurbishment labour, recovery-fleet operations, expendable upper stages, propellant, insurance, or range costs, and it is not a launch price.
Flight-Proven Share (FPS). FPS = flight-proven launches ÷ total orbital launches, from a single filing so the numerator and denominator share a definition and a snapshot date. SpaceX reports “over 540” and “approximately 650,” so 540 ÷ 650 = 83.08% is stated as a floor rather than a point estimate.
Cross-source figures. The 42.2% gap between the 2025 global fleet average and the 2018 Falcon 9 benchmark divides one published figure by another; we present both constructions rather than combining them, because unit flyaway cost standardized across 4,405 launches and a single vehicle’s list price divided by expendable capacity are not compatible methodologies. The 28.3% / 71.7% split between within-family learning and reallocation is the ratio of two learning rates published in the same paper (6% and 21.2% per doubling), not a decomposition of realized cost shares; the authors’ own Bennett decomposition is the authoritative treatment.
Scope. Estimates are labelled as estimates throughout. Company design targets, qualification goals and forecast scenarios are marked as such and are not presented as observed outcomes. Two figures — the fleet leader’s 36th flight and the 40-flight qualification target — come from trade coverage rather than a filing, and are flagged in the CSV with is_primary = no.
About This Dataset
The accompanying CSV contains 131 rows across 15 provenance columns, covering booster reuse counts, launch cadence, cost per kilogram, licensing volumes, and vehicle design targets for the period 1960 to 2026, with forecast rows through 2040. Seventy-nine rows carry primary sources; 47 are Axis Intelligence Research calculations, each with its formula recorded in the method_note field.
Released under CC BY 4.0. Reuse, redistribution and modification are permitted with attribution.
Citation
APA — Axis Intelligence Research. (2026). Reusable rocket statistics 2026: Booster reuse, cost per kilogram and the amortization cliff. https://axis-intelligence.com/reusable-rocket-statistics/
MLA — Axis Intelligence Research. “Reusable Rocket Statistics 2026: Booster Reuse, Cost per Kilogram and the Amortization Cliff.” Axis Intelligence, 18 Aug. 2026, axis-intelligence.com/reusable-rocket-statistics/.
Chicago — Axis Intelligence Research. “Reusable Rocket Statistics 2026: Booster Reuse, Cost per Kilogram and the Amortization Cliff.” Axis Intelligence. August 18, 2026. https://axis-intelligence.com/reusable-rocket-statistics/.
Frequently Asked Questions
How many times can a Falcon 9 booster be reused?
SpaceX’s Form S-1 states that as of March 31, 2026, a Falcon 9 first stage had been reflown 34 times. Trade coverage has since reported the fleet leader passing 36 flights, and a company qualification target of 40 flights per stage, neither of which has appeared in a primary filing.
Does a booster’s twentieth flight save as much as its second?
No, and the gap is enormous. Axis Intelligence Research calculates that the second flight cuts the per-flight build-cost charge by 50 percentage points, while the twentieth cuts it by 0.263 points. By flight twenty, 97.4% of the available amortization benefit is already banked.
If deep reuse barely saves money, why do operators pursue it?
Because per-flight build cost stopped being the binding constraint. A stage cleared for another flight is a stage the factory does not have to produce, so deep reuse buys fleet availability and cadence rather than unit-cost reduction. SpaceX flew 161 FAA-licensed launches in FY2025; no manufacturing line supplies that manifest with fresh hardware.
What is the cost per kilogram to orbit right now?
The 2025 global fleet average was $3,868 per kilogram in 2024 dollars, per Terzi and Nicoli in PNAS Nexus. Individual vehicles run far below that — NASA benchmarked Falcon 9 at $2,720 per kilogram in 2018 — because most of the world’s payload does not fly on the cheapest available launcher.
Will Starship actually reach $100 per kilogram?
No published primary source supports that figure. The PNAS Nexus authors estimate roughly $1,000 per kilogram at entry into service conditional on full reusability, with room to fall further as production standardizes. SpaceX’s own S-1 states a target of reducing cost to orbit by 99% or more against the historical average, which the filing puts at $18,500 per kilogram.
Has any operator besides SpaceX landed and reflown an orbital booster?
Landed, yes; reflown, not yet. Blue Origin’s New Glenn landed its first stage on a recovery ship in November 2025 after losing the booster on the January 2025 maiden flight. LandSpace’s Zhuque-3 reached orbit on December 3, 2025 but lost its booster to anomalous combustion during the landing burn.
What is the reflight turnaround bottleneck?
Refurbishment cycle time and pad availability, not vehicle supply. The FAA explicitly lists variable launch rates for reusable vehicles among the factors that make cadence hard to forecast, and notes that mishap investigations and return-to-flight periods can consume months of a manifest.
How much of the historical launch-cost decline came from reusability itself?
Less than the popular account suggests. PNAS Nexus separates within-rocket-family learning, running at roughly 6% per doubling of payload, from reallocation of payload onto cheaper launchers. Axis Intelligence Research calculates reallocation at 71.7% of the aggregate 21.2% per-doubling decline.
Does concentration on one provider threaten further cost reductions?
It is the risk the PNAS Nexus authors name most directly. With roughly 75% of global payload on a single provider, a monopolist’s pricing incentives and governments buying strategic autonomy both push payload back toward more expensive domestic vehicles — reversing the reallocation that drove most of the historical decline.
How many reusable launches does the FAA expect by 2036?
The agency forecasts a range rather than a point: 507 authorized operations in FY2036 under the high case, 282 under the low case, against 204 in FY2025. It raised its low case this year specifically citing routine rocket landings and declining launch costs.
Others Pages
Satellite Market Statistics 2026 · Space Economy Statistics · Satellite Internet Statistics · Starlink Statistics · Drone Statistics · Robotaxi Statistics · Space Tourism Statistics