

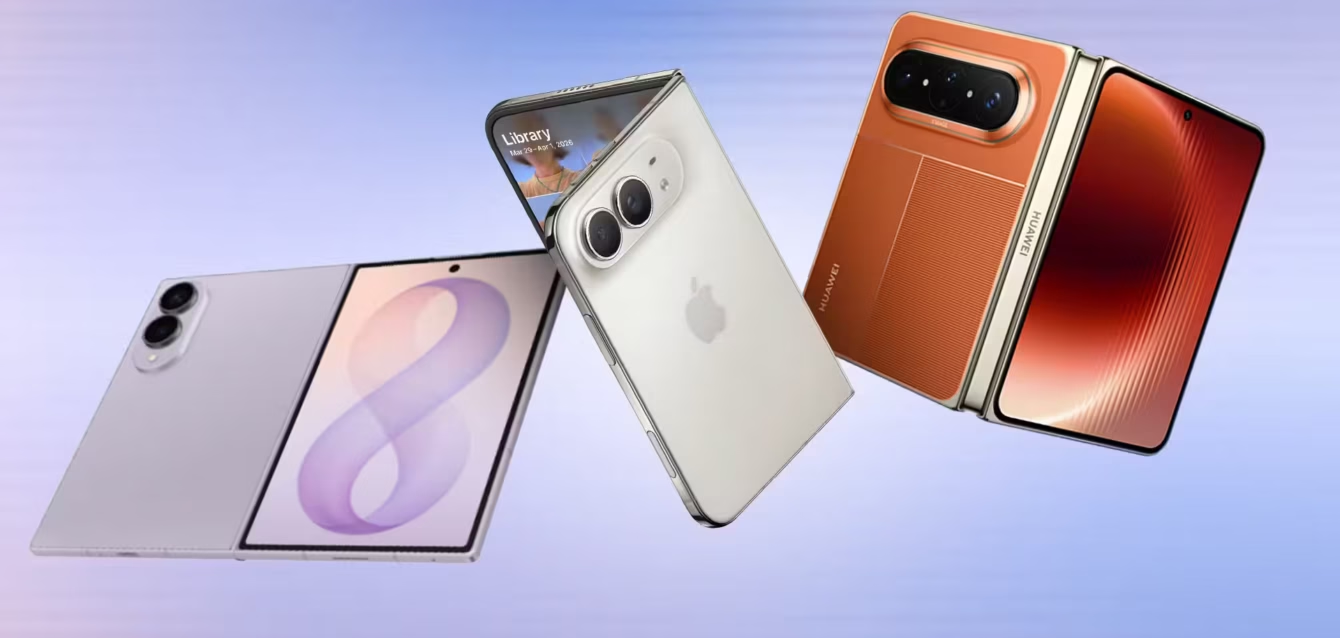
Foldable Phone Market Share 2026
By Axis Intelligence Research
Co-author: Alex Rivera | Last updated: September 12, 2026 | License: CC BY 4.0
Samsung is forecast to hold 38% of global foldable phone shipments in 2026, Apple 25% and Huawei 22%, according to Counterpoint Research’s August 2026 forecast update. Axis Intelligence Research finds those three figures imply a 24.0-million-unit market — a number Counterpoint does not publish — and that the gap between first and second place widened by six percentage points in seven weeks.
Quick Answer
Global foldable phone market share in 2026 breaks down as Samsung 38%, Apple 25% and Huawei 22% on a sell-in shipment basis, per Counterpoint Research’s forecast published September 7, 2026. Axis Intelligence Research calculates the implied market at 24.0 million units, roughly 4.8% above IDC’s 22.9-million forecast. Apple’s iPhone Duo, priced from $1,999, ships October 23 — leaving a 70-day selling window.
Key Findings
- According to Counterpoint Research’s forecast published September 7, 2026, Samsung will hold 38% of global foldable smartphone shipments in 2026, Apple 25% and Huawei 22%.
- Axis Intelligence Research calculates an implied 2026 foldable market of 24.0 million units, derived by dividing Counterpoint’s stated 6-million-unit Apple forecast by Apple’s stated 25% share.
- Axis Intelligence Research’s Foldable Leadership Margin (FLM) — the gap in percentage points between the first- and second-placed vendor — moved from 7.0 points to 13.0 points between Counterpoint’s July 21 and September 7, 2026 forecast editions, an 86% widening driven entirely by Samsung’s revision.
- Omdia measured actual first-half 2026 foldable shipments at 5.1 million units, down 21.6% year over year; Axis Intelligence Research calculates that Omdia’s own full-year floor of 22 million therefore places 77% of 2026 volume in the second half.
- Apple’s iPhone Duo starts at $1,999, which Axis Intelligence Research notes is $100.99 below the Galaxy Z Fold8 Ultra and $99.01 above the standard Galaxy Z Fold8 — Apple entered the category without a price premium over Samsung’s flagship foldable.
What Is the Foldable Phone Market Share in 2026?
The headline split, on Counterpoint Research’s most recent published edition, is Samsung 38%, Apple 25%, Huawei 22%. Everything else — Motorola, HONOR, Xiaomi, Google, vivo, OPPO — divides the remaining 15%.
That is the answer most readers want, and it is worth immediately flagging what it is not. These are sell-in shipments: units moved from manufacturer to channel, not units sold through to buyers. Counterpoint states this basis explicitly in its March 2026 edition. For a category launching its single largest product in late October, sell-in and sell-through will diverge sharply in Q4, and the 2026 figures will be settled by what Apple ships into retail, not what walks out of it.
Global foldable phone market share by vendor, 2026 forecast
| Vendor | 2026F share | Implied units (Axis calculated) | Source |
|---|---|---|---|
| Samsung | 38% | 9.12M | Counterpoint Research, Sep 7, 2026 |
| Apple | 25% | 6.00M | Counterpoint Research, Sep 7, 2026 |
| Huawei | 22% | 5.28M | Counterpoint Research, Sep 7, 2026 |
| All others | 15% | 3.60M | Axis Intelligence Research (residual) |
| Total | 100% | 24.00M | Axis Intelligence Research (derived) |
Unit figures are Axis Intelligence Research calculations. Counterpoint publishes percentage shares and a 6-million-unit Apple forecast; it does not publish a 2026 unit total. The implied market equals 6.0M ÷ 0.25 = 24.0M. The “all others” row is the residual after the three named vendors and is not a Counterpoint figure.
Alex Rivera: The residual is the interesting row. Fifteen percent, split across at least six vendors, is what is left of the Android foldable field once Samsung and Huawei take their cut — and Motorola, HONOR and Xiaomi are all shipping real hardware into it. Counterpoint’s own July edition put Motorola at 8% and HONOR at 3%, which leaves something close to four points for everyone else combined. That is not a market segment. That is a rounding error with a launch event attached.
Source: Axis Intelligence Research — CC BY 4.0
Introducing the Foldable Leadership Margin (FLM)
Vendor share tables are static. What actually moved this year is the distance between the leader and the challenger, and no tracker publishes that as a metric. Axis Intelligence Research does.
FLM — Foldable Leadership Margin. The margin, in percentage points, between the largest and second-largest vendor’s forecast global foldable shipment share, computed per published forecast edition.
Formula: FLM = share(rank 1) − share(rank 2)
Inputs come only from figures stated in the body text of a published forecast. Chart-only values are excluded because they cannot be read to a stated precision.
FLM readings
| Forecast edition | Published | Rank 1 | Rank 2 | FLM |
|---|---|---|---|---|
| Counterpoint Foldable Smartphone Market Forecast, Q1 2026 | Jul 21, 2026 | Samsung 32% | Apple 25% | 7.0 pts |
| Counterpoint Foldable Smartphone Market Forecast, Aug 2026 update | Sep 7, 2026 | Samsung 38% | Apple 25% | 13.0 pts |
Between those two editions the FLM widened by 6.0 points — an 86% increase in 48 days. Apple’s number never moved. Samsung’s did, by six points, and Huawei’s fell from 24% to 22%.
What this signals: the revision is a Samsung story, not an Apple story. Somewhere between late July and early September, Counterpoint’s read on Samsung’s 2026 sell-in improved materially. The Galaxy Z Fold8 reached general availability on August 7, 2026, inside that window. The wide-format Fold8 — Samsung’s answer to the book-type shift — is the most plausible single cause, and Omdia independently named it as a growth driver in its August 20 release.
What would reverse it: any downgrade to Samsung’s Q4 sell-in, or an Apple supply ramp that beats Counterpoint’s stated 6-million ceiling. The FLM narrows on either.
What FLM does not capture: it is a two-vendor measure and says nothing about the tail. For concentration across the full field, Axis Intelligence Research computes a Herfindahl-Hirschman score of 2,298 on Counterpoint’s July edition — the only edition publishing a five-vendor breakdown in text (Samsung 32, Apple 25, Huawei 24, Motorola 8, HONOR 3), with the unallocated 8% residual excluded from the sum.
How Much Have 2026 Foldable Forecasts Actually Changed?
This is the question nobody in the category answers, because answering it requires keeping every dated edition rather than overwriting with the latest one. Axis Intelligence Research maintains the ledger below.
The Axis foldable forecast revision ledger
| Published | Source | 2026 market growth | 2026 market size | Apple 2026 share | Samsung 2026 share |
|---|---|---|---|---|---|
| Dec 9, 2025 | IDC | +30% YoY | — (2025 base: 20.6M) | — | — |
| Feb 10, 2026 | Counterpoint | — | — | — | — |
| Mar 17, 2026 | Counterpoint | +20% YoY | — | 28% | — |
| Jul 21, 2026 | Counterpoint | +21% YoY | — | 25% | 32% |
| Aug 20, 2026 | Omdia | >+22% YoY | >22M | — | — |
| Aug 2026 | IDC | +12.6% YoY | 22.9M | — | — |
| Sep 7, 2026 | Counterpoint | — (2027: +37%) | — | 25% | 38% |
Source: publisher press releases as dated. Blank cells indicate the figure was not stated in that release’s body text. Compiled by Axis Intelligence Research.
Three things fall out of the ledger.
Apple’s share forecast was cut, then held. Counterpoint opened the year at 28% in March, revised to 25% in July, and left it at 25% in September even after Apple’s product was on stage. Three editions, one downgrade, then stability. For a vendor with no shipment history in the category, that is an unusually settled number.
The market-growth forecasts diverged rather than converged. IDC opened at +30% in December 2025 and finished at +12.6% by August — a downgrade of more than half. Omdia landed above +22%. Counterpoint sat at +21% in July. As the year got shorter and the uncertainty should have collapsed, the spread between the highest and lowest published growth rate stayed close to ten points.
Every published forecast predates the product. Counterpoint’s September 7 edition — the most recent — went out two days before Apple announced the iPhone Duo’s name, specification and $1,999 price on September 9. Every share figure quoted anywhere in the market today was set without knowing what Apple would charge.
Alex Rivera: Forecast revisions are usually treated as embarrassing and quietly buried. They are the most informative thing a tracker produces. A number that moves six points in seven weeks is telling you the analyst’s confidence interval is wider than the point estimate suggests, and anyone quoting “Samsung 38%” as settled fact in October is quoting a figure that was 32% in July.
How Big Is the Foldable Market in 2026 — And Why Do Trackers Disagree?
Three firms, three answers, and the spread is wider than the category’s entire annual growth in a normal year.
2026 global foldable market size by tracker
| Tracker | 2026 forecast | Basis | Published |
|---|---|---|---|
| Counterpoint Research | 24.0M (Axis-derived from stated share + units) | Sell-in shipments | Sep 7, 2026 |
| IDC | 22.9M | Worldwide Quarterly Mobile Phone Tracker | Aug 2026 |
| Omdia | >22M | Smartphone Feature Forecast | Aug 20, 2026 |
Axis Intelligence Research calculates the Counterpoint-to-IDC spread at 1.1 million units, or 4.8%. That sounds narrow until you weigh it against the 2025 baselines, where the same three firms are also apart: IDC put 2025 at 20.6 million, Omdia at 18.2 million. A 2.4-million-unit disagreement about a year that has already finished is the real signal here. If the trackers cannot agree on the past, the 4.8% spread on the future is optimistic.
The likely causes are methodological rather than sloppy. Sell-in definitions differ on channel inventory treatment, and the vendors themselves disclose nothing. Huawei’s China volumes are notoriously hard to source, and Huawei sits at 22% of this market.
The second-half concentration
Here is the finding that reframes the whole year. Omdia measured actual first-half 2026 shipments at 5.1 million units, down 21.6% year over year, with flip-type devices down 47%. Against Omdia’s own full-year floor of 22 million, Axis Intelligence Research calculates that 16.9 million units — 77% of 2026’s volume — must land in the second half.
That calculation stays inside a single tracker’s methodology, so it is clean. Applied against the Counterpoint-implied 24.0-million market it rises toward 79%, though that version mixes Omdia actuals with a Counterpoint forecast and Axis Intelligence Research publishes it only as a bounded estimate, not a finding.
Either way: the foldable phone market in 2026 is not an annual market. It is a ten-week event in the fourth quarter, and it is contingent on two product ramps — Apple’s from October 23 and Samsung’s Fold8 from August 7.
How Does Apple’s iPhone Duo Change Foldable Market Share?
Apple announced the iPhone Duo on September 9, 2026. It starts at $1,999 for 256GB and runs to $3,199 for 2TB. Pre-orders open October 16; general availability begins October 23 in more than 70 countries, with 28 more added October 30.
Axis Intelligence Research calculates the 2026 selling window at 70 days (October 23 through December 31). Counterpoint’s ceiling of 6 million units across that window works out to roughly 85,700 units per day, every day, including the December 30 and 31 of a memory-constrained supply year.
Foldable entry pricing, verified September 11, 2026
| Device | Entry price (US) | Entry storage | Availability | Source |
|---|---|---|---|---|
| Galaxy Z Flip8 | $1,199.99 | 256GB | Aug 7, 2026 | Samsung Newsroom |
| Galaxy Z Fold8 | $1,899.99 | 256GB | Aug 7, 2026 | Samsung Newsroom |
| iPhone Duo | $1,999.00 | 256GB | Oct 23, 2026 | Apple Newsroom |
| Galaxy Z Fold8 Ultra | $2,099.99 | 256GB | Aug 7, 2026 | Samsung Newsroom |
The pricing story has been widely misread. Apple did not price above the category. Axis Intelligence Research finds the iPhone Duo entered $100.99 below the Galaxy Z Fold8 Ultra and $99.01 above the standard Galaxy Z Fold8 — landing Apple’s first foldable in the middle of Samsung’s existing ladder rather than above it.
At the entry tier alone, 6 million units at $1,999 is a $12.0 billion revenue floor for Apple in the category’s first quarter of Apple participation. Realized ASP will run higher, since the ladder extends to $3,199 and Apple’s storage mix historically skews upward, but $12.0 billion is the arithmetic floor and it is defensible.
Alex Rivera: Watch the attach and the ramp, not the launch-week noise. A 70-day window means the Duo has no recovery quarter inside 2026 — a two-week supply slip costs Apple 20% of its selling days. That is why Counterpoint’s Liz Lee framed 6 million as a ceiling rather than a target, and why IDC’s “more than 10 million” figure is quoted against Apple’s first year of availability, not the 2026 calendar year. Those two numbers are not in conflict. They are measuring different things, and almost every write-up this month has compared them as if they weren’t.
Which Foldable Form Factor Is Winning?
The share war is happening inside one form factor, and the clamshell is losing badly.
| Metric | 2025 | 2026 | Source |
|---|---|---|---|
| Book-type share of foldable shipments | 52% | 65% (forecast) | Counterpoint Research, Feb 10, 2026 |
| Book-type share of shipments, 1H26 actual | — | 69% | Omdia, Aug 20, 2026 |
| Flip-type shipments, 1H26 vs 1H25 | — | −47% | Omdia, Aug 20, 2026 |
Two independent trackers converge here, which is rare in this category and worth stating plainly: Counterpoint forecast 65% book-type for the full year in February; Omdia measured 69% in the first half. Both point the same direction with the same magnitude.
Omdia also reports that Huawei and Samsung together took 75% of the book-type segment in the first half of 2026 — Axis Intelligence Research calculates the book-type segment at 3.52 million units in 1H26 (69% of 5.1 million), putting the Huawei-plus-Samsung book-type volume near 2.64 million units.
The wide-format sub-segment is the newest wrinkle. Omdia’s Zaker Li credits Huawei with pioneering it via the Pura X Max in May 2026, with Samsung following in the Galaxy Z Fold8 in August. Apple’s iPhone Duo — 7.6-inch inner display, 5.4-inch outer, passport proportions — is a wide-format book-type device. Three of the four largest vendors in the category converged on the same aspect ratio within six months.
Alex Rivera: The clamshell collapse is the under-covered story of 2026. Flip devices fell 47% in the first half. That form factor carried the category’s volume growth from 2021 through 2024 on the strength of being the cheap way in, and it has now been squeezed from both sides: memory costs pushed entry prices up, and the productivity argument moved the premium buyer to book-type. Samsung still sells the Z Flip8 at $1,199.99. It is no longer the device that grows the category.
Where Do Honor, Xiaomi and Motorola Fit?
They fit in the residual, and the residual is shrinking.
Counterpoint’s July 21, 2026 edition — the last to publish a five-vendor breakdown in text — put Motorola at 8% and HONOR at 3% for 2026. Xiaomi was not assigned a share figure in any Counterpoint release reviewed here; Counterpoint’s September 7 note states only that Xiaomi is expected to launch the Xiaomi 18 Fold, alongside foldable work at Motorola, HONOR, Google, vivo and OPPO.
Axis Intelligence Research will not assign Xiaomi a share number, because no tracker has published one. Anyone quoting a specific Xiaomi foldable share for 2026 is quoting an estimate without a published source behind it.
Applying Counterpoint’s July percentages to the Axis-implied 24.0-million market gives Motorola roughly 1.9 million units and HONOR roughly 0.7 million — figures Axis Intelligence Research labels as estimates, since they cross a July share against a September-derived market size.
Alex Rivera: Motorola at 8% is the number people underrate. Razr built that on aggressive clamshell pricing, in the exact form factor that just fell 47%. Motorola’s book-type Razr Fold is the hedge, and 2027 tells you whether the hedge worked. HONOR at 3% in a market this concentrated is a portfolio line item, not a position.
Methodology
Collection. Every figure in this analysis was retrieved from the publisher’s own press release or newsroom page between September 10 and September 11, 2026. No figure is carried over from prior Axis publications or from secondary aggregation. Where a figure appeared only inside a chart image and not in body text, it was excluded — this is why several cells in the revision ledger are blank rather than estimated.
Sources used. Counterpoint Research (four dated forecast releases: February 10, March 17, July 21 and September 7, 2026), IDC (Worldwide Quarterly Mobile Phone Tracker, December 2025 and August 2026), Omdia (Smartphone Feature Forecast, August 20, 2026), Apple Newsroom (September 9, 2026) and Samsung Global Newsroom (July 22, 2026).
Axis-calculated figures and their formulas.
- Implied 2026 market size: Apple’s stated unit forecast ÷ Apple’s stated share = 6.0M ÷ 0.25 = 24.0M. Both inputs from Counterpoint, September 7, 2026.
- Implied vendor units: implied market × stated vendor share.
- Foldable Leadership Margin (FLM): rank-1 share − rank-2 share, per forecast edition, using body-text figures only.
- Second-half concentration: (Omdia 2026 floor − Omdia 1H26 actual) ÷ Omdia 2026 floor = (22.0 − 5.1) ÷ 22.0 = 76.8%, rounded to 77%. Single-tracker computation.
- Apple selling window: October 23 to December 31, 2026 inclusive = 70 days. Apple availability date from Apple Newsroom.
- Apple daily run rate: 6,000,000 ÷ 70 = 85,714 units per day.
- Price deltas: iPhone Duo entry price minus each Samsung entry price, from both vendors’ newsroom pages.
- Apple entry-tier revenue floor: 6,000,000 × $1,999 = $11.994B, stated as $12.0B.
- Concentration score: sum of squared percentage shares for the five vendors named in Counterpoint’s July 21 edition = 32² + 25² + 24² + 8² + 3² = 2,298. The 8% unallocated residual is excluded.
On methodology compatibility. Counterpoint, IDC and Omdia use different sell-in definitions and disagree on the 2025 baseline by 2.4 million units. Axis Intelligence Research therefore keeps cross-tracker arithmetic out of the findings and confines it to explicitly labelled estimates. The second-half concentration figure of 77% uses Omdia inputs only, on both sides of the calculation.
Basis. All share and shipment figures are sell-in shipments unless otherwise stated. Sell-in is not sell-through, and for a category whose largest product launches in late October, the two will diverge in Q4 2026.
About This Dataset
The accompanying CSV contains every quantitative claim in this article as a row, with the source organisation, source document, source URL, retrieval date, primary-source flag and Axis-calculation flag for each. Values are raw — no currency symbols, no percent signs, no thousands separators. Dates are ISO 8601. Rows marked axis_calculated = yes carry a method note pointing to the formula disclosed in the Methodology section above.
Coverage: global, vendor-level and category-level, 2025 actual through 2027 forecast. Licence: CC BY 4.0. Free to use, redistribute and build on, including commercially, with attribution. Attribution line: Axis Intelligence Research, Foldable Phone Market Share 2026, 2026.
Journalists, analysts and researchers are welcome to reproduce any table on this page with attribution. If a figure here conflicts with another source, we would rather hear about it than not — [email protected].
Citation
APA Axis Intelligence Research. (2026). Foldable phone market share 2026: Apple, Samsung, Huawei, Honor and Xiaomi. https://axis-intelligence.com/foldable-phone-market-share/
MLA Axis Intelligence Research. “Foldable Phone Market Share 2026: Apple, Samsung, Huawei, Honor and Xiaomi.” Axis Intelligence, 12 Sept. 2026, axis-intelligence.com/foldable-phone-market-share/.
Chicago Axis Intelligence Research. “Foldable Phone Market Share 2026: Apple, Samsung, Huawei, Honor and Xiaomi.” Axis Intelligence. September 12, 2026. https://axis-intelligence.com/foldable-phone-market-share/.
Frequently Asked Questions
Is the 38% Samsung foldable share figure a forecast or an actual result?
A forecast. It comes from Counterpoint Research’s Foldable Smartphone Market Forecast update published September 7, 2026, and covers full-year 2026 sell-in shipments — a year with more than three months left to run at time of publication. Samsung’s figure in the same forecast series was 32% seven weeks earlier. Treat 38% as a current estimate, not a result.
Why does Apple’s foldable share get quoted as both 25% and 31%?
Because the two numbers come from different trackers measuring different things. Counterpoint’s 25% is Apple’s share of calendar-year 2026 global foldable shipments, tied to a stated ceiling of 6 million units. IDC’s figures are anchored to a 22.9-million market and, separately, to a “more than 10 million” estimate that IDC applies to the iPhone Duo’s first year of availability — which runs well into 2027. Comparing a calendar-year figure with a first-year-of-availability figure produces a disagreement that does not exist.
Does foldable market share mean units sold to consumers?
No. Every share figure cited here is sell-in: units shipped from vendor to channel. Sell-through — units actually bought — is a separate measure that these releases do not report. The distinction matters most in Q4 2026, because a vendor can ship heavily into retail in December and record the share while the devices are still on shelves in January.
Apple’s foldable costs $1,999 — is that a premium over Samsung?
Not against Samsung’s flagship. The Galaxy Z Fold8 Ultra starts at $2,099.99, so the iPhone Duo undercuts it by $100.99 at the entry tier. The Duo does sit $99.01 above the standard Galaxy Z Fold8 at $1,899.99. Apple placed its first foldable inside Samsung’s existing price ladder rather than above it — a different strategy from the one most pre-launch coverage assumed.
If foldables are growing, why did shipments fall in the first half of 2026?
They did fall — Omdia measured 5.1 million units in 1H26, down 21.6% year over year, with flip-type devices down 47%. Growth for the full year depends entirely on the second half. Axis Intelligence Research calculates that 77% of Omdia’s own 2026 volume floor has to land after June 30. The category’s 2026 growth is a Q4 event, not a trend line.
Which foldable form factor should a buyer choose in 2026?
The market is answering this for you: book-type devices moved from 52% of shipments in 2025 to 65% forecast for 2026, and Omdia measured 69% in the first half. Flip-type volume dropped 47% year over year. If resale value, app support and future model availability matter to you, the book-type and wide-format designs are where vendor investment is going. Flip devices remain the cheaper entry — the Galaxy Z Flip8 starts at $1,199.99 — but the category is not building around them.
What is the wide-format foldable everyone is launching?
A book-type foldable with a shorter, wider aspect ratio, giving a more tablet-like shape when open. Omdia credits Huawei with pioneering it in the Pura X Max in May 2026, followed by Samsung’s Galaxy Z Fold8 in August. Apple’s iPhone Duo fits the same pattern — a 7.6-inch inner display and 5.4-inch outer display in passport proportions. Three of the four largest vendors in the category converged on it within six months.
Where does Xiaomi rank in foldable market share?
No tracker reviewed for this analysis has published a 2026 foldable share figure for Xiaomi. Counterpoint’s September 7 release notes that Xiaomi is expected to launch the Xiaomi 18 Fold but assigns it no share. Axis Intelligence Research will not publish a Xiaomi share number until one is sourced — any specific figure circulating now is an unsourced estimate.
How reliable are foldable market share forecasts generally?
Less reliable than the precision implies. Counterpoint moved Apple’s 2026 share from 28% to 25% between March and July, and Samsung’s from 32% to 38% between July and September. IDC cut its 2026 category growth forecast from 30% to 12.6%. And the three major trackers disagree about 2025 — a completed year — by 2.4 million units. The direction of travel in these forecasts is dependable; the second digit is not.
When will actual 2026 foldable market share be known?
Not until the trackers publish full-year 2026 data, typically in the first quarter of 2027 — and even then, revisions follow. Apple’s contribution will be the hardest to pin down, since the iPhone Duo ships October 23 and Apple does not disclose per-model unit sales. Axis Intelligence Research will update this page when Q4 2026 shipment data is published.