

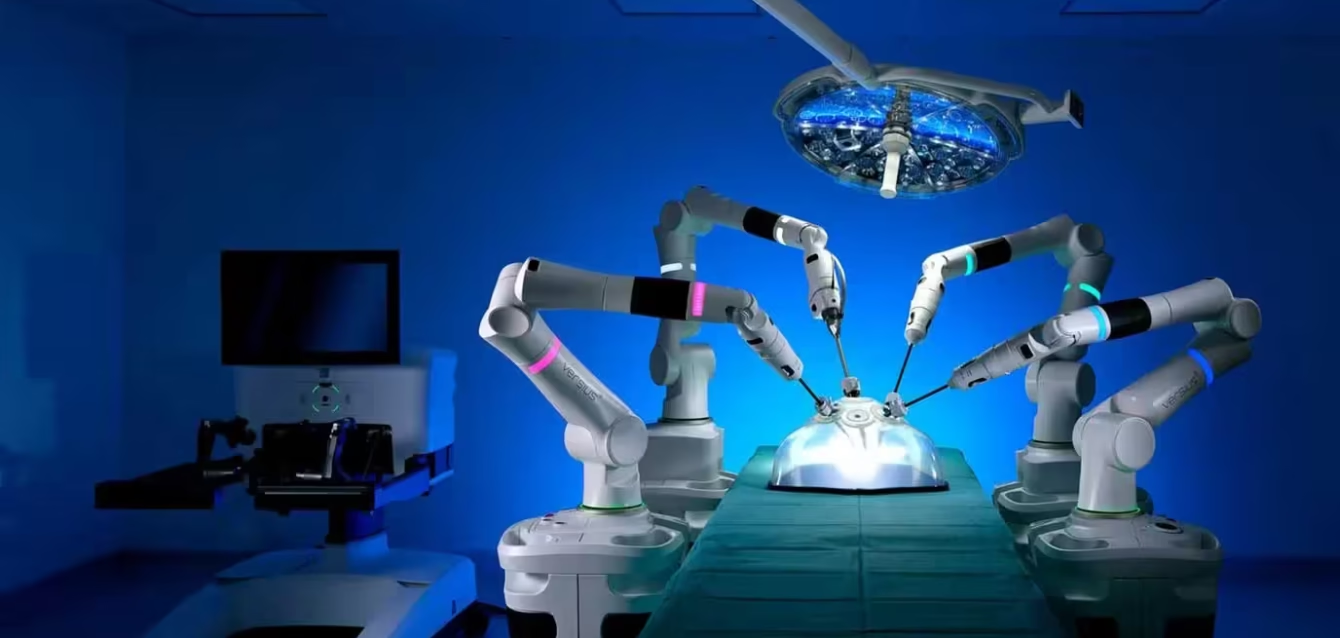
Robotic Surgery Statistics 2026
By Axis Intelligence Research
Co-authors: Liam Michael (robotics) & Jennifer Miller (clinical evidence) | Last updated: August 11, 2026 | License: CC BY 4.0
Surgeons performed approximately 3,153,000 procedures on da Vinci surgical systems worldwide in 2025, an 18% increase over 2024, on an installed fleet that reached 11,710 systems by June 30, 2026. According to Axis Intelligence Research, the average system now carries 300.2 procedures a year, and 75.6% of US robotic surgery volume sits in specialties where a rival platform is finally authorized.
Quick Answer
Global da Vinci procedure volume reached 3,153,000 in 2025, up approximately 18% from 2,683,000 in 2024, performed across an installed base that closed the year at 11,106 systems and grew to 11,710 by June 30, 2026. According to Axis Intelligence Research, the fleet’s System Utilization Yield (SUY) — procedures per installed system per year — reached 300.2 in 2025, the first year the average da Vinci crossed 300 cases. Two rival platforms received FDA marketing authorization within eight months: Medtronic’s Hugo on December 3, 2025, and Johnson & Johnson’s OTTAVA on July 22, 2026.
Key Findings
- According to Intuitive’s preliminary full-year results published January 14, 2026, approximately 3,153,000 surgical procedures were performed with da Vinci systems in 2025, an increase of about 18% over roughly 2,683,000 in 2024.
- According to Axis Intelligence Research, the System Utilization Yield of the global da Vinci fleet rose from 262.7 procedures per system in 2022 to 300.2 in 2025, a compound annual gain of 4.5%.
- According to Axis Intelligence Research, fleet expansion contributed 13.5 percentage points of 2025’s 17.5% procedure growth while per-system utilization contributed 3.5 points — capacity, not throughput, remains the primary growth engine.
- According to Axis Intelligence Research, the Contested Procedure Share of US robotic surgery moved from 0.0% on December 2, 2025 to 75.6% on July 22, 2026, as FDA authorizations for Medtronic Hugo and Johnson & Johnson OTTAVA opened urology and upper-abdomen general surgery to competition.
- According to a February 2026 national registry study of France’s PMSI database, robotic-assisted procedures carried a mean hospital stay of 4.2 days against 5.7 for laparoscopy and 7.9 for open surgery, with ICU admission at 6.3% versus 9.7% and 14.1%.
How Many Robotic Surgeries Are Performed Each Year?
The single most reliable global count comes from Intuitive Surgical, because the company estimates procedure volume across its own installed base and discloses it every quarter. In its preliminary fourth quarter and full year 2025 results, Intuitive reported approximately 3,153,000 da Vinci procedures for 2025.
That figure is not the whole robotic surgery market. It excludes Ion bronchoscopy procedures, which Intuitive reports separately and which grew approximately 51% in 2025, and it excludes every procedure performed on a Medtronic, CMR Surgical, Distalmotion, Medicaroid, MicroPort or SS Innovations platform. It remains the best-documented series available, because no competitor publishes an equivalent procedure count.
Global da Vinci Procedures, 2020 to 2025
| Year | Procedures | Year-over-year change | Source |
|---|---|---|---|
| 2020 | 1,243,000 | — | Intuitive preliminary FY2021 results |
| 2021 | 1,594,000 | +28% | Intuitive preliminary FY2021 results |
| 2022 | 1,875,000 | +18% | Intuitive preliminary FY2022 results |
| 2023 | 2,286,000 | +22% | Intuitive preliminary FY2023 results |
| 2024 | 2,683,000 | +17% | Intuitive preliminary FY2024 results |
| 2025 | 3,153,000 | +18% | Intuitive preliminary FY2025 results |
Intuitive guides to worldwide da Vinci procedure growth of approximately 13.5% to 15.5% in 2026, and told investors in July 2026 it expects to land near the midpoint of that range. Through the first half of 2026 the company reported da Vinci procedure growth of approximately 16% in Q1 and approximately 15% in Q2.
Liam Michael writes: Five straight years of 17% to 28% growth on a base that has more than doubled is the rarest pattern in capital medical equipment — the installed base keeps compounding and the cases per box keep rising at the same time. Most automation categories get one or the other. What that growth does not tell you is whether the marginal case is a case that needed a robot. More than half of da Vinci procedures are performed for benign conditions, per Intuitive’s own 10-K, and benign is where the cost-effectiveness argument is thinnest.
How Many da Vinci Systems Are Installed Worldwide?
Intuitive reported a da Vinci installed base of 11,710 systems as of June 30, 2026, up 12% from 10,488 a year earlier, in its second quarter 2026 earnings release. Adding 1,096 Ion endoluminal systems, the company exited the quarter with 12,806 robotic platforms installed globally.
Installed Base by Year-End
| Date | da Vinci systems | Ion systems | Source |
|---|---|---|---|
| Dec 31, 2021 | 6,730 | — | Intuitive FY2022 Form 10-K |
| Dec 31, 2022 | 7,544 | — | Intuitive FY2022 Form 10-K |
| Dec 31, 2023 | 8,606 | 534 | Intuitive FY2023 Form 10-K |
| Dec 31, 2024 | 9,902 | 805 | Intuitive FY2025 Form 10-K |
| Dec 31, 2025 | 11,106 | 995 | Intuitive FY2025 Form 10-K |
| Mar 31, 2026 | 11,395 | 1,041 | Intuitive Q1 2026 earnings release |
| Jun 30, 2026 | 11,710 | 1,096 | Intuitive Q2 2026 earnings release |
Installed Base by Region
Intuitive’s Form 10-K for fiscal year 2025, filed with the SEC on February 3, 2026, breaks the fleet down geographically.
| Region | Dec 31, 2023 | Dec 31, 2024 | Dec 31, 2025 | Share of fleet 2025 | Source |
|---|---|---|---|---|---|
| United States | 5,111 | 5,807 | 6,364 | 57.3% | Intuitive FY2023 and FY2025 Form 10-K |
| Europe | 1,617 | 1,867 | 2,168 | 19.5% | Intuitive FY2023 and FY2025 Form 10-K |
| Asia | 1,484 | 1,745 | 1,993 | 17.9% | Intuitive FY2023 and FY2025 Form 10-K |
| Rest of world | 394 | 483 | 581 | 5.2% | Intuitive FY2023 and FY2025 Form 10-K |
| Total | 8,606 | 9,902 | 11,106 | 100% | Intuitive Form 10-K |
Regional shares are Axis Intelligence Research calculations from the disclosed unit counts: 6,364 divided by 11,106 gives 57.3%.
Placements in 2025 totalled 1,721 da Vinci systems against 1,526 in 2024, of which 987 went to US customers, 342 to Europe, 269 to Asia and 123 to other markets. Da Vinci 5 accounted for 870 of the 2025 placements, up from 362 in 2024.
What Is the Axis System Utilization Yield (SUY)?
SUY — System Utilization Yield. The number of procedures performed per installed da Vinci system per year, computed by Axis Intelligence Research from Intuitive’s disclosed procedure counts and year-end installed base.
Intuitive reports procedure growth and installed base growth separately, and reports directional utilization change (“average system utilization increased 4%”) without publishing the underlying rate. SUY converts both disclosures into a single absolute number a hospital administrator, an analyst or a competitor can benchmark against.
Formula
SUY(year) = Procedures(year) / [ (Installed base at end of prior year + Installed base at end of year) / 2 ]
The denominator is the mean of opening and closing installed base, which approximates the average number of systems available to perform cases during the year. Using closing installed base alone understates utilization; using opening base alone overstates it.
Inputs and readings
| Year | Procedures | Opening fleet | Closing fleet | Mean fleet | SUY (procedures/system/year) |
|---|---|---|---|---|---|
| 2022 | 1,875,000 | 6,730 | 7,544 | 7,137 | 262.7 |
| 2023 | 2,286,000 | 7,544 | 8,606 | 8,075 | 283.1 |
| 2024 | 2,683,000 | 8,606 | 9,902 | 9,254 | 289.9 |
| 2025 | 3,153,000 | 9,902 | 11,106 | 10,504 | 300.2 |
Source: Axis Intelligence Research calculation from Intuitive Surgical procedure disclosures and SEC Form 10-K installed base figures.
Worked example for 2025: (9,902 + 11,106) / 2 = 10,504 systems. 3,153,000 / 10,504 = 300.2 procedures per system.
SUY rose from 262.7 to 300.2 between 2022 and 2025, a compound annual gain of 4.5%. Baseline reading for the series is 2022 at 262.7; earlier years are not computed because the 2020 and 2021 fleet counts fall in a period when COVID-19 disruption makes annual averaging unreliable as a utilization proxy.
Growth decomposition: fleet versus throughput
Because procedure growth is the product of fleet growth and utilization growth, SUY lets the two be separated exactly.
- Mean fleet grew from 9,254 to 10,504 — a factor of 1.1351, or +13.5%
- SUY grew from 289.9 to 300.2 — a factor of 1.0353, or +3.5%
- 1.1351 x 1.0353 = 1.1752, matching the observed procedure growth of 3,153,000 / 2,683,000 = 1.1752, or +17.5%
According to Axis Intelligence Research, roughly four-fifths of 2025’s procedure growth came from putting more robots in more operating rooms, and one-fifth from working existing robots harder.
Liam Michael writes: That ratio is the number to watch, not the headline. A business whose growth is 80% fleet expansion is a business selling capital equipment into a finite population of hospitals with operating rooms and credentialed surgeons. A business whose growth is throughput is compounding on an installed base it already owns. SUY has climbed 4.5% a year for three years — real, but slow. Show me a year where the utilization line contributes half the growth and I will move the terminal-value number.
What this reading does not capture. SUY treats every system as equally available for a full year, so a system installed in December counts the same as one installed in January; mean-fleet averaging is a correction for this, not a cure. It mixes multi-port, single-port and third-generation systems into one denominator despite very different case profiles, and it counts procedures of very different length as one unit each. It covers da Vinci only, and describes Intuitive’s fleet rather than the market.
Which Companies Compete in Robotic Surgery in 2026?
For twenty-five years the answer in US soft-tissue surgery was one company. That ended in an eight-month window.
Medtronic announced on December 3, 2025 that the FDA had cleared the Hugo robotic-assisted surgery system for urologic procedures including prostatectomy, nephrectomy and cystectomy — procedures Medtronic put at about 230,000 US surgeries a year. The clearance rested on the Expand URO investigational device exemption study, which enrolled 137 patients: 55 prostatectomy, 29 cystectomy and 53 nephrectomy, of which 36 were partial and 17 radical.
Johnson & Johnson submitted OTTAVA for De Novo classification on January 7, 2026 and announced on July 22, 2026 that the FDA had granted De Novo authorization for ten named general surgery procedures within the upper abdomen: Roux-en-Y gastric bypass, gastrectomy, cholecystectomy, splenectomy, gastric sleeve, small bowel resection, appendectomy, lysis of adhesions, fundoplication and hiatal hernia repair. OTTAVA integrates four robotic arms into the operating table and, on the company’s own evaluation of systems available as of September 2025, occupies 30% to 50% less operating room space than boom- and cart-mounted systems.
Axis US Soft-Tissue Robotic Authorization Ledger — snapshot as of August 11, 2026
| Company | Platform | US regulatory status | Date | Pathway | Indication scope | Source |
|---|---|---|---|---|---|---|
| Intuitive Surgical | da Vinci (5, X, Xi, SP, Si) | Cleared | 2000 onward | 510(k), Class II | General laparoscopic surgery plus numerous added indications; over 70 representative clinical uses | Intuitive FY2025 Form 10-K |
| Medtronic | Hugo RAS | Cleared | Dec 3, 2025 | 510(k) | Urologic: prostatectomy, nephrectomy, cystectomy | Medtronic press release |
| Johnson & Johnson | OTTAVA | Authorized | Jul 22, 2026 | De Novo | Ten named upper-abdomen general surgery procedures | Johnson & Johnson press release |
| Medtronic | Hugo RAS | Submission pending | Apr 2026 (filed), disclosed Jun 3, 2026 | 510(k) | General surgery including hernia repair; gynecologic surgery | Medtronic press release |
| Johnson & Johnson | OTTAVA | Trial ongoing | Announced Jul 22, 2026 | IDE | Inguinal hernia | Johnson & Johnson press release |
Compiled by Axis Intelligence Research from company regulatory announcements. Snapshot date August 11, 2026. Platforms outside multi-port soft-tissue surgery, and platforms authorized in other jurisdictions only, are out of scope.
Medtronic disclosed on June 3, 2026 that it had filed 510(k) submissions to extend Hugo into general surgery including hernia repair and into gynecologic surgery, completed enrollment in the Embrace Gynecology IDE study, and received clearance for ProGrip Advanced mesh for robotic ventral hernia repair. Medtronic put US ventral hernia repair at nearly 470,000 procedures a year. On the same earnings call, CEO Geoff Martha said Hugo worldwide procedure volume was growing at two to three times the market rate; the company has not published an absolute Hugo procedure count or installed base, which is the single largest gap in the competitive picture.
Intuitive’s own FY2025 Form 10-K names fourteen companies that have introduced robotic-assisted products or stated an intent to: Beijing Surgerii Robotics, CMR Surgical, Distalmotion, Harbin Sizhe Rui, Johnson & Johnson, Karl Storz, Medicaroid, Medtronic, meerecompany, Noah Medical, Shandong Weigao, Shanghai MicroPort MedBot, Shenzhen Edge Medical and SS Innovations.
What Share of US Robotic Surgery Is Now Contested?
CPS — Contested Procedure Share. The share of annual US da Vinci procedure volume that falls in specialty groups where at least one non-Intuitive platform holds current FDA marketing authorization, measured at a stated date.
CPS answers a question no vendor and no market-research firm publishes: how much of the actual American robotic caseload a hospital could now, legally, put on a different robot. Platform counts alone overstate competition, because a challenger authorized in a small specialty contests very little volume.
Formula
CPS(date) = US da Vinci procedure volume in contested specialty groups / US da Vinci procedure volume in all measured specialty groups
Inputs
| Specialty group | US da Vinci procedures, 2025 | Share of measured base | Challenger authorized? | Date authorized |
|---|---|---|---|---|
| General surgery | 1,250,000 | 65.1% | Yes — OTTAVA | Jul 22, 2026 |
| Gynecology | 468,000 | 24.4% | No — Hugo 510(k) pending | — |
| Urology | 201,000 | 10.5% | Yes — Hugo | Dec 3, 2025 |
| Measured base | 1,919,000 | 100% | — | — |
US procedure split reported by MedTech Dive from Intuitive’s disclosures, June 2026; flagged as company-reported and non-primary. Authorization dates from Medtronic and Johnson & Johnson press releases.
Readings
| Snapshot date | Contested volume | CPS | Trigger |
|---|---|---|---|
| Dec 2, 2025 | 0 | 0.0% | Baseline — no authorized challenger |
| Dec 3, 2025 | 201,000 | 10.5% | Hugo urology clearance |
| Jul 22, 2026 | 1,451,000 | 75.6% | OTTAVA general surgery authorization |
| Aug 11, 2026 | 1,451,000 | 75.6% | Unchanged |
Worked example: (1,250,000 + 201,000) / 1,919,000 = 1,451,000 / 1,919,000 = 75.6%.
According to Axis Intelligence Research, three-quarters of the US robotic surgery caseload is now theoretically contestable, up from none nine months ago — and gynecology, at 468,000 procedures, is the last uncontested quarter, pending Medtronic’s gynecologic 510(k).
What this reading does not capture. CPS measures regulatory contestability, not commercial substitution. OTTAVA’s authorization covers ten named upper-abdomen procedures, not the entire general surgery basket, so the general surgery group is treated as contested at specialty-group granularity and the reading is an upper bound within that group. The measured base of 1,919,000 excludes roughly 81,000 US da Vinci procedures in cardiothoracic and head-and-neck surgery, which are not separately reported in the source. The input split is company-reported through a trade publication rather than fetched from a filing, and will be replaced when Intuitive discloses a comparable specialty split in a primary document. CPS says nothing about installed base, pricing, contracting or surgeon credentialing, all of which move slower than regulatory status.
Liam Michael writes: Authorization is the cheapest part. A hospital that already owns four da Vinci systems, has trained ninety surgeons on da Vinci consoles and buys da Vinci staplers by the pallet does not switch because a second robot exists. It switches when the second robot is the fifth robot — the incremental capacity purchase where the incumbent has no credentialing advantage. That is why the interesting number in 2027 is not authorizations, it is placements. Show me the purchase orders and I will move the number.
What Do the Outcomes Data Show?
The strongest recent population-level evidence comes from France, where robotic procedures became separately traceable in the national hospital discharge database in March 2020. A study published in the Journal of Robotic Surgery on February 23, 2026 by the French National Academy of Surgery used the PMSI national administrative database to analyze every adult robotic soft-tissue procedure in 2021 and 2022.
Robotic-assisted versus laparoscopic versus open, France 2021 to 2022
| Outcome | Robotic | Laparoscopic | Open | Source |
|---|---|---|---|---|
| Mean length of stay (days) | 4.2 | 5.7 | 7.9 | Saiydoun et al., J Robot Surg, 2026 |
| ICU admission rate | 6.3% | 9.7% | 14.1% | Saiydoun et al., J Robot Surg, 2026 |
| 30-day readmission rate | 4.8% | 5.6% | 6.9% | Saiydoun et al., J Robot Surg, 2026 |
| Urology 30-day reoperation | 0.7% | 0.8% | 1.5% | Saiydoun et al., J Robot Surg, 2026 |
| Urology 90-day reoperation | 0.9% | 1.0% | 1.6% | Saiydoun et al., J Robot Surg, 2026 |
| Digestive 30-day reoperation (non-bariatric) | 3.3% | 3.1% | 7.4% | Saiydoun et al., J Robot Surg, 2026 |
The authors report 58,232 robotic-assisted procedures across the two years, rising from 27,011 in 2021 to 31,221 in 2022, and estimate roughly 20,000 hospital bed-days saved nationally in 2022.
Jennifer Miller writes: The gradient in that table is the finding, and it is not the one the marketing uses. Robotic beats open decisively on every row. Robotic beats laparoscopy by 1.5 days of stay and 3.4 points of ICU admission — real, but a fraction of the open-surgery gap, and PMSI carries no tumour staging, no BMI, no frailty index, so the comparison is unadjusted for the case selection that sends easier patients to the robot. The authors say so themselves. The honest reading is that most of the measured benefit is the benefit of not operating open, which laparoscopy also delivers, and that the incremental case for robotics over laparoscopy still rests on a cost argument the same paper prices at roughly $4,600 per patient above laparoscopy.
A source discrepancy we are not reconciling
The French study reports its national total inconsistently. The abstract states 58,232 procedures; the results section states 58,912 while listing the same annual figures of 27,011 and 31,221, which sum to 58,232; the discussion states growth “from 27,691 to 31,221.” Axis Intelligence Research uses 58,232 and 27,011 because those are the only internally consistent pair, and flags the others rather than silently averaging. Anyone citing this study should cite the annual figures, not the two-year total.
Which Specialties Use Surgical Robots Most?
France’s mandatory procedure coding produces the cleanest specialty penetration data published anywhere, because it counts every case in a country rather than sampling hospitals.
| Specialty | Share of robotic procedures | Robotic penetration rate | Source |
|---|---|---|---|
| Urology | 61% | 54.9% | Saiydoun et al., J Robot Surg, 2026 |
| General and digestive surgery | 17% | 11.4% | Saiydoun et al., J Robot Surg, 2026 |
| Gynecology | 15% | 13.6% | Saiydoun et al., J Robot Surg, 2026 |
| Thoracic surgery | 7% | 16.3% | Saiydoun et al., J Robot Surg, 2026 |
Robotic procedures accounted for 15.6% of all minimally invasive operations in the covered specialties, while open surgery still represented 17.3% of procedures overall and exceeded 25% in some subspecialties.
The US mix is close to the inverse. Of roughly 2 million US da Vinci procedures in 2025, general surgery accounted for about 1,250,000, gynecology 468,000 and urology 201,000 — general surgery is the American engine, urology the French one. Intuitive attributed 2025’s growth largely to 18% growth in US general surgery procedures and 23% growth in total procedures performed outside the US.
Where Is Robotic Surgery Access Unequal?
The French data also quantify something almost no country measures: territorial inequality in access to robotic surgery.
| Region | Robotic procedures per 100,000 inhabitants (2022) | Source |
|---|---|---|
| Île-de-France | 12.5 | Saiydoun et al., J Robot Surg, 2026 |
| Auvergne-Rhône-Alpes | 7.1 | Saiydoun et al., J Robot Surg, 2026 |
| Provence-Alpes-Côte d’Azur | 6.8 | Saiydoun et al., J Robot Surg, 2026 |
| Occitanie | 5.2 | Saiydoun et al., J Robot Surg, 2026 |
| Bourgogne-Franche-Comté | Below 2 | Saiydoun et al., J Robot Surg, 2026 |
| Centre-Val de Loire | Below 2 | Saiydoun et al., J Robot Surg, 2026 |
| Overseas departments | Below 2 | Saiydoun et al., J Robot Surg, 2026 |
Île-de-France alone accounted for more than 27% of national robotic activity. Only 35% of French hospitals performed any robotic surgery in 2022, and the correlation between regional GDP per capita and robotic penetration was moderate but significant at r = 0.52. The national installed base rose from 135 systems in 2017 to approximately 260 by 2023.
Jennifer Miller writes: A 6-to-1 spread in per-capita access inside a single universal healthcare system is the statistic that should be travelling, and it is not. Regions with no robotic platform also showed the highest residual open surgery rates — 19.5% in urology, 25.4% in non-bariatric digestive surgery, 24.8% in hysterectomy, 30.1% in thoracic surgery, with regional peaks above 40%. The device is not the intervention. The distribution of the device is.
Who Pays for Robotic Surgery?
Not the payer, in most cases. Intuitive states plainly in its FY2025 Form 10-K that the majority of payers, including Medicare, treat robotic assistance as a tool used to perform the procedure and do not pay providers more for a procedure that involves a da Vinci, Ion or any other robotic system.
That single sentence explains most of the economics. Hospitals absorb the capital cost, the service contract and the per-case instrument spend, and recover it through length-of-stay reduction, complication avoidance, throughput and surgeon recruitment — not through reimbursement. It is why Intuitive’s usage-based leasing has grown: 872 of the 1,721 systems placed in 2025 went out under operating lease arrangements, of which 496 were usage-based.
Intuitive’s revenue structure reflects the same logic. Second quarter 2026 revenue of $2.89 billion split into $1.73 billion of instruments and accessories, $685 million of systems and $472 million of services — recurring revenue, not box sales, is the business. Full-year 2025 revenue reached approximately $10.06 billion, up 21% from $8.35 billion in 2024, with 68% of 2025 revenue domestic.
How Big Is the Market Outside the United States?
Outside-US markets took 32% of Intuitive’s 2025 revenue and 42.7% of the installed base as of December 31, 2025. Three constraints shape international growth.
China operates a quota. Under the 2023 quota published by the China National Health Commission, the government allowed the sale of 559 new surgical robots, which may include da Vinci systems as well as competing platforms; actual sales depend on hospitals completing tender processes. Intuitive manufactures for the Chinese market through a majority-owned joint venture with Shanghai Fosun Pharmaceutical.
Japan gates adoption through reimbursement rather than approval. Intuitive received Japanese regulatory clearance for da Vinci 5 in July 2025 for all specialties indicated for da Vinci Xi except cardiac. Reimbursement for new procedures is set by the Ministry of Health, Labour and Welfare on even-numbered-year cycles and requires in-country clinical data.
Europe runs on the EU Medical Devices Regulation, with EUDAMED registration obligations for economic operators and devices becoming applicable on May 28, 2026.
Methodology
Collection. Every figure in this page was retrieved from a primary document during production between August 10 and August 11, 2026. Sources comprise Intuitive Surgical SEC filings (Form 10-K for fiscal years 2022, 2023 and 2025), Intuitive quarterly and preliminary-results press releases from January 2022 through July 2026, Medtronic corporate press releases of December 3, 2025 and June 3, 2026, the Johnson & Johnson press releases of January 7 and July 22, 2026, and the peer-reviewed French national registry study published in the Journal of Robotic Surgery on February 23, 2026. One input — the US da Vinci procedure split by specialty — is company-reported figures relayed by a trade publication rather than a filing, and is flagged as non-primary in the dataset and inline at point of use.
Proprietary metrics. Two metrics are constructed by Axis Intelligence Research. SUY (System Utilization Yield) divides annual da Vinci procedures by the mean of opening and closing installed base. CPS (Contested Procedure Share) divides US da Vinci procedure volume in specialty groups holding a non-Intuitive FDA authorization by the total measured US specialty base. Both formulas, all inputs and all snapshot dates are disclosed above; both are recomputable by any reader from the cited sources. Methodology revisions will be stated and historical readings will not be silently restated.
Rounding. SUY is reported to one decimal place; CPS to one decimal place; regional shares to one decimal place. Percentages described as “approximately” are Intuitive’s own hedged disclosures and are reproduced with the hedge intact rather than given false precision.
Scope and caveats. This page covers robotic-assisted soft-tissue surgery and endoluminal procedures. Orthopaedic robotics, neurosurgical stereotactic systems, radiosurgery and interventional catheter robotics are out of scope. Global procedure figures reflect Intuitive’s platforms only, because no competitor publishes a comparable count; the true global robotic caseload is higher by an undisclosed margin. The French outcomes data are unadjusted for case mix and reflect one healthcare system in 2021 and 2022.
Where this fits. This page covers surgical and medical robotics. Industrial deployment, density and order pricing live on our industrial robot statistics page, cross-sector automation on the robotics statistics pillar, general-purpose platforms in humanoid robot statistics, and autonomous vehicles in robotaxi statistics. Company-level automation analysis continues in our Tesla statistics report, and the full catalogue sits in the Axis statistics library.
About This Dataset
Dataset: Robotic Surgery Statistics 2026 — global procedure volumes, installed base by region and quarter, US regulatory authorizations, specialty penetration, perioperative outcomes, and the Axis SUY and CPS metric series.
Coverage: 2017 through August 11, 2026. Global, United States, Europe, Asia, France. 162 observations.
File: robotic-surgery-statistics-2026.csv
License: CC BY 4.0 — reuse, adapt and redistribute with attribution.
Provenance: every row carries source organisation, source document, source URL, retrieval date, a primary-source flag, an Axis-calculated flag, and a method note where a figure is derived.
How to Cite This Research
APA: Axis Intelligence Research, Michael, L., & Miller, J. (2026, August 11). Robotic surgery statistics 2026: Procedures, installed base, market share and the year competition arrived. Axis Intelligence. https://axis-intelligence.com/robotic-surgery-statistics/
MLA: Axis Intelligence Research, Liam Michael, and Jennifer Miller. “Robotic Surgery Statistics 2026: Procedures, Installed Base, Market Share and the Year Competition Arrived.” Axis Intelligence, 11 Aug. 2026, axis-intelligence.com/robotic-surgery-statistics/.
Chicago: Axis Intelligence Research, Liam Michael, and Jennifer Miller. “Robotic Surgery Statistics 2026: Procedures, Installed Base, Market Share and the Year Competition Arrived.” Axis Intelligence. August 11, 2026. https://axis-intelligence.com/robotic-surgery-statistics/.
Dataset citation: Axis Intelligence Research, Robotic Surgery Statistics 2026, 2026. CC BY 4.0.
Frequently Asked Questions
How many robotic surgeries are performed each year worldwide?
Approximately 3,153,000 procedures were performed with da Vinci surgical systems in 2025, up about 18% from 2,683,000 in 2024, per Intuitive Surgical’s preliminary full-year results. That count excludes Ion bronchoscopy and every procedure performed on a competing platform, none of which publish comparable annual totals, so the true global figure is higher by an undisclosed margin.
How many da Vinci robots are there in the world?
11,710 da Vinci surgical systems as of June 30, 2026, up 12% year over year, alongside 1,096 Ion endoluminal systems. At the end of 2025 the da Vinci fleet stood at 11,106 systems: 6,364 in the United States, 2,168 in Europe, 1,993 in Asia and 581 in the rest of the world.
How many procedures does a single surgical robot perform per year?
According to Axis Intelligence Research, the average da Vinci system performed 300.2 procedures in 2025 — the System Utilization Yield, computed as annual procedures divided by mean installed base. The figure has risen from 262.7 in 2022 at a compound rate of 4.5% a year. Individual systems vary widely around that average by specialty mix and hospital volume.
Does Medicare pay hospitals more for robotic surgery?
No. Intuitive states in its FY2025 Form 10-K that the majority of payers, including Medicare, consider robotic assistance a tool used to perform the procedure and do not pay providers more for a procedure involving a robotic system. Hospitals recover the capital and per-case instrument cost through length-of-stay reduction, complication avoidance and throughput rather than incremental reimbursement.
Is robotic surgery better than laparoscopic surgery?
The French national registry study found robotic procedures carried a mean stay of 4.2 days against 5.7 for laparoscopy and 6.3% ICU admission against 9.7%, with 30-day reoperation rates that were comparable rather than better in urology (0.7% versus 0.8%). The gap against open surgery is far larger than the gap against laparoscopy, and the data are unadjusted for case selection. The same paper cites incremental per-patient cost of roughly $4,600 versus laparoscopy.
Which surgical specialty uses robots most?
It depends on the country. In France, urology accounts for 61% of robotic procedures with 54.9% penetration, while general and digestive surgery sits at 11.4% penetration. In the United States, general surgery is the largest segment at roughly 1,250,000 da Vinci procedures in 2025, against 468,000 in gynecology and 201,000 in urology.
Who competes with Intuitive Surgical in 2026?
Medtronic’s Hugo received FDA clearance for urologic procedures on December 3, 2025, and Johnson & Johnson’s OTTAVA received De Novo authorization for ten upper-abdomen general surgery procedures on July 22, 2026. Intuitive’s own 10-K names fourteen companies active in or entering the field, including CMR Surgical, Distalmotion, Karl Storz, Medicaroid, Shanghai MicroPort MedBot and SS Innovations.
What is the Contested Procedure Share of US robotic surgery?
75.6% as of August 11, 2026, according to Axis Intelligence Research — the share of US da Vinci procedure volume in specialty groups where a non-Intuitive platform holds FDA marketing authorization. It was 0.0% on December 2, 2025 and 10.5% after Hugo’s urology clearance the following day. Gynecology, at 468,000 US procedures, remains the largest uncontested segment pending Medtronic’s gynecologic 510(k).
How much of a hospital’s robotic caseload is cancer surgery?
More than half of da Vinci procedures are performed for benign conditions rather than cancer, per Intuitive’s FY2025 Form 10-K. Benign and short-term elective procedures are also the more seasonal segment, running higher in the fourth quarter when US patients have met annual deductibles and lower in the first quarter after deductibles reset.
Is robotic surgery growing faster than the robot fleet?
No. According to Axis Intelligence Research, of 2025’s 17.5% procedure growth, 13.5 percentage points came from a larger installed fleet and 3.5 points from higher per-system utilization. Growth remains primarily a function of placing more systems rather than working existing systems harder.