

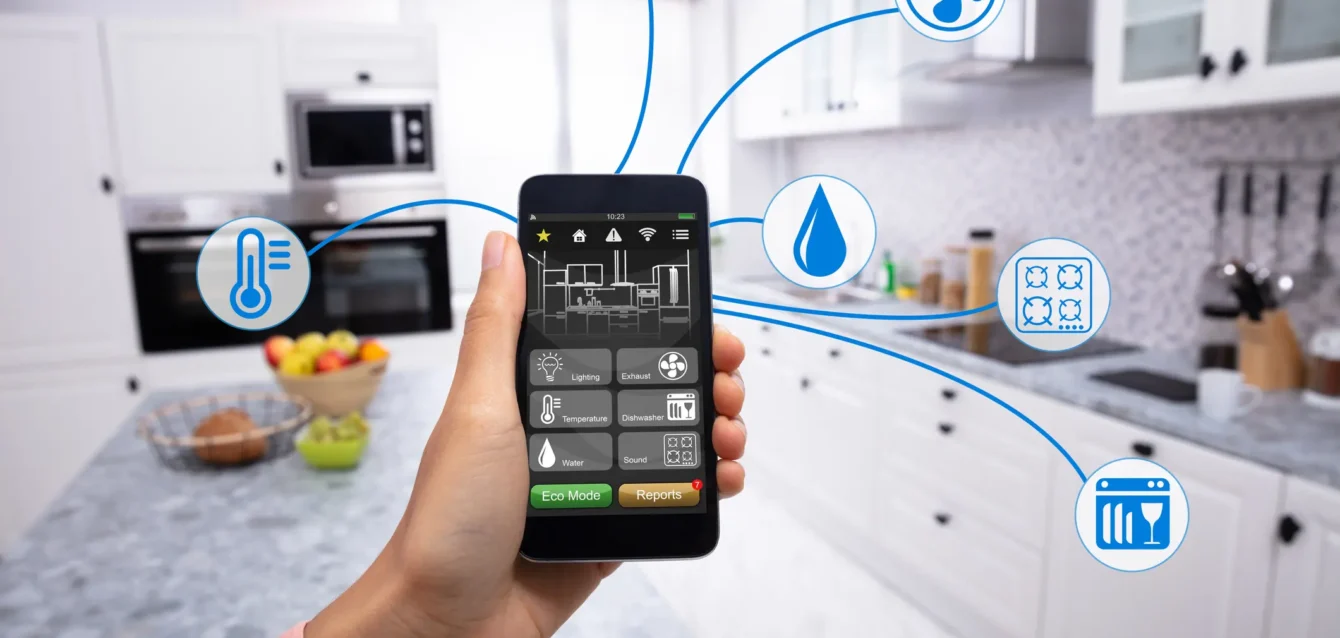
Smart Appliance Statistics 2026
By Axis Intelligence Research
Co-author: Jeff Aaron | Last updated: August 22, 2026 | License: CC BY 4.0
Smart Appliance Statistics at a Glance
The U.S. household appliance base spans 132.5 million primary residences. Refrigerators are present in 99.7% of them; microwaves in 95.3%; clothes washers in 85.2%; dishwashers in 75.0% — figures drawn from the U.S. Energy Information Administration’s 2024 Residential Energy Consumption Survey. Absent the federal efficiency standards that govern those appliances, the average U.S. household would have paid roughly $6,115 more on utility bills over the decade 2016–2025, and total U.S. electricity consumption in 2025 would have run 14% higher than it did. Axis Intelligence Research scores the current U.S. appliance base at 62.56 on the Smart Appliance Readiness and Energy Impact Index (SAREI) — the baseline reading for 2024 survey data, published August 2026.
Quick Answer
How widely are appliances used in U.S. homes and what is their energy impact?
The EIA surveyed 132.54 million occupied primary U.S. residences in 2024. Refrigerator penetration stands at 99.7%, microwaves at 95.3%, clothes washers (in-home) at 85.2%, clothes dryers (in-home) at 84.0%, and dishwashers at 75.0%. Federal appliance efficiency standards saved the average U.S. household $6,115 on utility bills over the past decade — about $612 per year — and kept U.S. electricity consumption 14% lower than it would otherwise have been in 2025, according to a January 2026 analysis by the Appliance Standards Awareness Project.
Key Findings
- The average U.S. household saved $6,115 over the decade 2016–2025 — roughly $612 per year — from federal appliance efficiency standards. Absent those standards, total U.S. electricity consumption in 2025 would have been 14% higher, per the Appliance Standards Awareness Project’s January 2026 analysis.
- Air fryers reached 43.7% weekly-use penetration among U.S. homes in 2024 — 57.93 million households — making them the fastest-growing small kitchen appliance category tracked in the EIA’s 2024 RECS, ahead of slow cookers (27.2%) and rice cookers (17.3%).
- 34.3% of U.S. households own two or more refrigerators (45.47 million homes out of 132.54 million), and 26.7% of primary refrigerators are 10 or more years old — a measurable replacement-cycle cohort for smart-connected models.
- Whirlpool Corporation, the only major U.S.-based kitchen and laundry manufacturer, posted $16.607 billion in net sales in 2024 and cited connected appliance integration — including Wi-Fi connectivity, voice-control compatibility, and over-the-air updates — as a core strategic priority in its 2024 10-K filing with the SEC.
- Electricity is the dominant range fuel in 59.1% of homes with ranges; 59.1% of the 115.92 million range-owning households run an electric cooktop. Electric dryers account for 81.7% of the 111.33 million homes with an in-home dryer — both figures shaping the smart-grid integration roadmap for major appliance manufacturers.
What Is the U.S. Home Appliance Market and Who Makes It?
The U.S. appliance industry operates at significant scale. Whirlpool Corporation — which manufactures under the Whirlpool, KitchenAid, Maytag, Amana, JennAir, Brastemp, Consul, and InSinkErator brands — reported $16.607 billion in net sales for fiscal year 2024, according to its Form 10-K filed with the Securities and Exchange Commission (CIK 106640, filing date January 29, 2025). That compares to $19.455 billion in 2023, with the decline primarily driven by the deconsolidation of Whirlpool’s European major domestic appliance business in April 2024 following a contribution agreement with Arçelik.
In its 10-K Item 1 Business section, Whirlpool stated that it “remained committed to delivering connected appliances that seamlessly integrate into the evolving smart home ecosystem,” highlighting Wi-Fi connectivity, voice-control compatibility with major smart home assistants, and over-the-air software updates for qualified connected appliances as its core execution priorities. The company also noted it launched more than 100 new products globally in 2024.
Whirlpool’s competitors in major domestic appliances include BSH (Bosch), Electrolux, Haier, LG, Mabe, Midea, Panasonic, and Samsung, and in small domestic appliances: Breville, DeLonghi, Ninja, Groupe SEB, and Cuisinart, per the 10-K.
The competitive framing matters for the smart-appliance story: connected features — scheduling, demand-response integration, remote diagnostics — have moved from premium differentiator to mid-tier expectation across washers, dryers, dishwashers, and refrigerators. That shift is documented in Whirlpool’s risk disclosures, which describe the connected appliance space as an area where failure to “adapt to changing consumer preferences” constitutes a material strategic risk.
Jeff Aaron: A $16.6B revenue line from one manufacturer tells you how large the appliance industry is but says nothing about what fraction of those units ship with a working app at month three. That’s the number nobody publishes. The useful proxy is over-the-air update adoption — a manufacturer who pushes software to connected appliances in the field is maintaining that connection. Whirlpool’s explicit mention of OTA updates in its 10-K is the signal worth noting.
How Many U.S. Homes Have Major Appliances? Full Penetration Data
The U.S. Energy Information Administration’s 2024 Residential Energy Consumption Survey (RECS), released in preliminary form in March 2026, surveyed nearly 17,000 households and weighted the results to represent 132.54 million occupied primary U.S. residences. The appliance data in Table HC3.1 covers the full range of kitchen, laundry, and food-storage appliances. All penetration rates below are Axis Intelligence Research calculations from those primary counts.
Table 1: U.S. Household Appliance Penetration, 2024
| Appliance | Homes (millions) | Penetration rate |
|---|---|---|
| Refrigerator (primary) | 132.11 | 99.7% |
| Microwave oven | 126.30 | 95.3% |
| Clothes washer (in-home) | 112.99 | 85.2% |
| Clothes dryer (in-home) | 111.33 | 84.0% |
| Dishwasher | 99.47 | 75.0% |
| Coffee maker (weekly use) | 97.12 | 73.3% |
| Outdoor grill | 69.78 | 52.6% |
| Air fryer (weekly use) | 57.93 | 43.7% |
| Separate freezer | 48.64 | 36.7% |
| Two or more refrigerators | 45.47 | 34.3% |
| Slow cooker (weekly use) | 36.04 | 27.2% |
| Rice cooker (weekly use) | 22.89 | 17.3% |
| Instant Pot / electric pressure cooker | 18.46 | 13.9% |
| Wine chiller | 7.10 | 5.4% |
Source: U.S. Energy Information Administration, Form EIA-457A, 2024 Residential Energy Consumption Survey (RECS), Table HC3.1, preliminary release March 2026. N = approx. 17,000 surveyed households, weighted to 132.54 million occupied primary U.S. residences. Penetration rates are Axis Intelligence Research calculations: appliance count ÷ 132.54 million total homes × 100.
The near-universal penetration of refrigerators (99.7%) and microwaves (95.3%) confirms these categories are mature; the story at those tiers is replacement cycle and smart-upgrade cadence, not adoption. Dishwashers at 75.0% and clothes washers at 85.2% still have meaningful gaps — the 25% of dishwasher-absent homes and 15% of washer-absent homes are disproportionately renters in multi-unit buildings, as the housing-type breakdowns below show.
The Air Fryer Penetration Story
The air fryer’s trajectory is the most telling signal in the 2024 RECS for anyone watching connected small-appliance adoption. At 57.93 million weekly-use households — 43.7% of all primary residences — it has overtaken the slow cooker (27.2%) and rice cooker (17.3%) in a matter of years. That speed of penetration is relevant because the air fryer has become the primary battleground for Wi-Fi and app-control integration at the mid-tier price point, with SmartThings, Google Home, and Amazon Alexa ecosystems all competing for attachment.
Jeff Aaron: 44% penetration for a product category that barely existed in most homes five years ago is not normal appliance growth — that’s platform growth. The connected-appliance version of this question is whether the app attachment rate follows the hardware attachment rate. It consistently does not, because the scheduling and recipe-sync features that drive app downloads rarely survive the realization that cooking is unpredictable. The brands that have solved for month-three retention are the ones with real recurring revenue arguments.
Range and Cooking Appliance Statistics
Of 132.54 million U.S. homes, 115.92 million (87.5%) have at least one range with both oven and cooktop. An additional 21.69 million (16.4%) have a separate wall oven, and 18.51 million (14.0%) have a separate cooktop.
Fuel split among the 115.92 million homes with a range:
| Fuel | Millions of homes | Share of range-owning homes |
|---|---|---|
| Electricity | 68.56 | 59.1% |
| Natural gas | 36.75 | 31.7% |
| Dual-fuel (electricity + gas or propane) | 5.85 | 5.0% |
| Propane | 4.76 | 4.1% |
Source: EIA RECS 2024, Table HC3.1. Shares are Axis Intelligence Research calculations. Sum of segments plus homes without a range equals total 132.54 million (verified).
The electric majority — 59.1% of range-owning homes — is the structural reason connected cooking roadmaps at Samsung, LG, and Whirlpool run further and faster on electric lines. Induction and standard-electric ranges accept Wi-Fi modules, demand-response scheduling, and remote preheat integrations more cleanly than gas units, where connectivity has fewer energy-management use cases.
How Does the Dishwasher Market Break Down?
Of the 99.47 million U.S. homes with a dishwasher, weekly usage patterns show a wide behavioral spread:
Usage frequency among dishwasher-owning homes:
- 19.17 million homes: used zero times per week (own the appliance, use it rarely)
- 31.30 million homes: used 2–3 times per week (modal use bucket)
- 20.42 million homes: used 4–6 times per week
- 13.65 million homes: used 7 or more times per week
On cycle selection, the overwhelming default is “normal or default cycle with heated dry” — chosen in 50.94 million homes. Only 5.29 million homes set the “energy saver” cycle as their standard, suggesting substantial behavioral savings potential if smart scheduling defaulted to energy-saver or off-peak modes automatically.
The 33.06 million homes that do not have a dishwasher are clustered in apartments in buildings of 5 or more units: dishwasher penetration drops to roughly 69% for that housing type versus near-100% in single-family detached homes.
Jeff Aaron: The 19 million homes that own a dishwasher but run it less than once a week are not the target for smart scheduling. The 13.65 million homes running it daily are — and that’s the cohort where time-of-use scheduling pays back. At $0.18/kWh and two daily runs shifted from peak to off-peak, the annual savings on a dishwasher alone is around $25–$40. Small, but real, and it’s the use case where smart really means something at the device level rather than at the marketing level.
Laundry Appliances: Washers and Dryers
Clothes washers are in-home at 85.2% of U.S. households. The remaining 14.8% (19.54 million homes) use shared laundry or laundromats — structurally excluded from in-home smart laundry markets.
Of the 112.99 million in-home washer households:
- 79.48 million are top-loading (70.3%)
- 33.51 million are front-loading (29.7%)
Clothes dryers are in-home at 84.0% of households. Fuel split of the 111.33 million homes with an in-home dryer:
- 90.96 million electric (81.7%)
- 19.09 million natural gas (17.1%)
- 1.28 million propane (1.2%)
The 81.7% electric dryer dominance in the installed base is the infrastructure fact that makes smart dryer integration — moisture sensors, push alerts, heat-pump conversion — most commercially viable. Heat-pump dryers, which cut energy use by 20–40% relative to electric resistance models, are still a small but growing share of new shipments. ENERGY STAR Specification V1.1 currently governs dryers; Version 2.0 is under development with an anticipated late 2026 timeline, per the U.S. DOE and EPA ENERGY STAR program planning documents.
Jeff Aaron: The moisture-sensor alert on a smart dryer is the feature that earns month-six engagement — not the app, not the scheduling. The alert that says “cycle complete, clothes dry, don’t run again” is a genuine behavior change that saves electricity and reduces fabric wear. That’s the connected feature that pays off at the household level, not the delayed-start scheduling which requires knowing exactly when your off-peak rate kicks in.
Refrigerator Age Distribution and the Replacement-Cycle Market
Of the 132.11 million homes with a primary refrigerator, the age breakdown from EIA RECS 2024 is:
Table 2: Primary Refrigerator Age, U.S. Homes, 2024
| Age category | Homes (millions) | Share of refrigerator-owning homes |
|---|---|---|
| Less than 2 years | 19.60 | 14.8% |
| 2 to 4 years | 33.88 | 25.6% |
| 5 to 9 years | 43.36 | 32.8% |
| 10 to 14 years | 21.12 | 16.0% |
| 15 to 19 years | 7.86 | 5.9% |
| 20 or more years | 6.29 | 4.8% |
Source: EIA RECS 2024, Table HC3.1. Shares are Axis Intelligence Research calculations.
35.27 million homes (26.7% of refrigerator-owning households) have a primary refrigerator that is 10 or more years old. That cohort predates most smart-connectivity features and, in many cases, predates the ENERGY STAR 2013 Version 5.0 specification that meaningfully reduced energy use. The DOE has stated that replacing a refrigerator 15 or more years old with a current ENERGY STAR-certified model saves approximately $55 per year on energy bills — before accounting for connectivity features.
34.3% of homes own a second refrigerator (45.47 million). The second unit is most often located in the garage (20.02 million homes) or elsewhere in the home (13.95 million homes). Second refrigerators skew older — 4.79 million second units are 20 or more years old — and are overwhelmingly a single-family detached phenomenon, since apartment-dwellers in large buildings have near-zero second-refrigerator penetration.
Jeff Aaron: A garage refrigerator is almost never networked, almost never ENERGY STAR certified, and is frequently a 15-year-old unit running at 800–1,200 kWh per year instead of the 300–500 kWh a current ENERGY STAR model draws. The smart-appliance replacement pitch for that cohort is purely economic. The connectivity features are a secondary close.
How Much Do Appliance Efficiency Standards Save U.S. Households?
Federal appliance efficiency standards — covering approximately 60 product categories, first enacted by Congress in 1987 — are the largest single driver of residential energy cost reduction in the U.S. appliance market. The Appliance Standards Awareness Project (ASAP) published a January 2026 policy analysis, “Appliance Efficiency Standards Lower Utility Bills and Cut Electricity Demand in Every State,” authored by Joanna Mauer and Rachel Margolis, quantifying the impact at the state level.
The national-level findings:
- A typical U.S. household would have paid approximately $6,115 more on utility bills over the decade 2016–2025 absent existing standards (national average from Table 1; actual range: $4,646 in North Dakota to $11,446 in Hawaii)
- Total U.S. electricity consumption in 2025 would have been 14% higher absent standards
- Summer peak demand would have been 115 GW higher — roughly double the total power demand of all U.S. data centers in 2025, per the ASAP analysis
- An additional 1.5 trillion gallons of water would have been wasted in 2025
- Households collectively would have paid $780 billion more over the decade; businesses an additional $330 billion
The utility bill savings from standards outweigh the incremental purchase price of more-efficient models by more than a factor of three, per the ASAP methodology. The DOE is legally required by Congress to periodically review and update standards; the ASAP analysis notes that proposed rollbacks of 17 existing standards, floated by DOE in May 2025, would reverse those savings.
Table 3: Per-Household Utility Bill Savings from Appliance Efficiency Standards, 2016–2025
| State | Per-household savings (2024$) | Electricity would have been higher (%) |
|---|---|---|
| Hawaii | $11,446 | 19% |
| Connecticut | $8,268 | 18% |
| Massachusetts | $8,231 | 19% |
| California | $7,996 | 19% |
| New York | $7,186 | 20% |
| U.S. Average | $6,115 | 14% |
| Virginia | $5,638 | 14% |
| Texas | $5,689 | 11% |
| Mississippi | $5,439 | 12% |
| North Dakota | $4,646 | 8% |
Source: ASAP / ACEEE, “Appliance Efficiency Standards Lower Utility Bills and Cut Electricity Demand in Every State,” January 2026, Tables 1 and 2. Figures in 2024 dollars. Electricity-higher percentages represent how much higher state electricity consumption would have been in 2025 absent existing standards.
Jeff Aaron: Hawaii’s $11,446 decade total versus North Dakota’s $4,646 is a rate-price story, not a climate story. Hawaii pays some of the highest electricity rates in the country; every kWh saved by a more efficient refrigerator or air conditioner is worth more on the bill than the same kWh saved in a low-rate market. The smart-appliance payback math follows the same logic — time-of-use scheduling, demand response, load shifting all pay faster in high-rate markets, and the appliance manufacturers who have segmented their connected-feature marketing by utility rate zone are ahead of the ones who pitch uniform payback periods.
The Axis SAREI: Smart Appliance Readiness and Energy Impact Index
What SAREI Measures
The Smart Appliance Readiness and Energy Impact Index (SAREI) is an Axis Intelligence Research composite metric that quantifies the U.S. residential appliance base’s combined penetration maturity and energy-savings efficiency in a single annual score. It is designed to track how far the installed appliance base has progressed toward high-connectivity, low-energy-intensity saturation — and to give journalists, analysts, and policymakers a single citable figure that summarizes the appliance market’s structural condition each year.
Formula
SAREI = [(A × 0.50) + (B × 0.30) + (C × 0.20)] × 100
Component A — Core appliance penetration composite (weight 50%): Arithmetic mean of penetration rates for the five foundational household appliances tracked continuously by EIA RECS: refrigerators, clothes washers, clothes dryers, dishwashers, and microwave ovens. All rates from EIA RECS 2024, Table HC3.1. Expressed as a decimal.
Component B — Efficiency savings quotient (weight 30%): ASAP-estimated annual average household utility savings from appliance efficiency standards ÷ EIA-derived average annual household electricity expenditure. Measures the actual energy-cost dividend the appliance base is delivering. Expressed as a decimal.
Component C — Connected small-appliance adoption proxy (weight 20%): Weekly air-fryer penetration rate from EIA RECS 2024. Used as the best available EIA-tracked leading indicator of connected small-appliance saturation — the fastest-growing category with active smart-connectivity investment. Expressed as a decimal.
2024 Baseline Calculation
Component values:
| Component | Value | Source |
|---|---|---|
| A — Core penetration composite | 87.84% | Mean of 5 EIA RECS 2024 HC3.1 penetration rates: 99.7% + 85.2% + 84.0% + 75.0% + 95.3% ÷ 5 |
| B — Efficiency savings quotient | 33.0% | $612 annual savings (ASAP 2026 $6,115 ÷ 10) ÷ $1,854 avg electricity spend (EIA: 10,332 kWh × $0.1794/kWh) |
| C — Connected small-appliance proxy | 43.7% | EIA RECS 2024 HC3.1: 57.93M ÷ 132.54M |
SAREI = [(0.8784 × 0.50) + (0.3299 × 0.30) + (0.4370 × 0.20)] × 100 = [0.43920 + 0.09897 + 0.08740] × 100 = 62.56
Baseline reading: 62.56 (2024 survey data, published August 2026)
Interpretation
A SAREI of 62.56 reflects a base of near-universal core appliance ownership (component A is high at 87.84%), meaningful efficiency savings already delivered by existing standards (component B at 33% of the typical electricity bill), and a connected small-appliance layer that has reached substantial but not saturated scale (component C at 43.7%). The index’s annual movement will be driven primarily by component C — core appliance penetration (A) is near-ceiling and efficiency savings (B) shifts slowly with regulatory cycles. Component C will move meaningfully each year as emerging appliance categories (air fryers, smart plugs, robovacs) grow or plateau.
Axis Intelligence Research will publish annual SAREI readings each August following the prior year’s EIA RECS housing characteristics release.
Jeff Aaron: The weight structure here is deliberate. Core appliance penetration gets 50% because it is the denominator for everything else — you cannot have smart-appliance adoption without appliance adoption. Efficiency savings gets 30% because it is the economic argument that justifies both the policy regime and the consumer upgrade decision. The connected small-appliance proxy gets 20% because it is the most forward-looking component but also the most volatile: a single viral category can move it in a year. The index gives that forward signal weight without letting it dominate a base that is fundamentally about stable, large appliances.
Housing Type and Appliance Penetration: Where the Gaps Are
The EIA RECS 2024 data shows appliance ownership varies substantially by housing type. Three patterns stand out for the smart-appliance market.
In-home laundry access is a function of housing type more than income. In single-family detached homes (82.51 million of the 132.54 million total), 97.4% have an in-home clothes washer. In apartments in buildings of 5 or more units (25.05 million homes), that figure drops to roughly 54%. The smart laundry market’s addressable U.S. base is those 112.99 million homes with in-home equipment — the 19.54 million laundromat-dependent homes are outside that market.
Second refrigerators and freezers are an overwhelmingly single-family phenomenon. Of the 45.47 million homes with two or more refrigerators, the vast majority are in single-family detached units with garages. In the 5-or-more-unit apartment segment, second refrigerator penetration is under 6%. The same pattern applies to separate freezers: 36.7% of all homes have one (48.64 million), but penetration in large apartment buildings is a fraction of that in detached houses.
Dishwasher penetration is the clearest housing-type gap. In single-family detached homes, penetration approaches 80%. In apartments of 5 or more units, it is substantially lower. That gap — roughly 25 percentage points between housing types — maps almost exactly onto the renter-versus-owner divide, since renters do not choose their own appliances and landlords installing or renovating large buildings often omit dishwashers to reduce per-unit costs.
The Connectivity Standard Landscape: What Matter 1.5 and 1.6 Mean for Appliances
The protocol environment for smart home devices has consolidated around Matter, the open-source IP-based standard developed by the Connectivity Standards Alliance. Its history is relevant to understanding where major appliance connectivity stands in 2026:
- Matter 1.0 — Published October 4, 2022. Founding participants included Amazon, Apple, Google, and Samsung SmartThings.
- Matter 1.3 — Published May 2024. Added new device types and enhanced support for low-power devices.
- Matter 1.5 — Published November 20, 2025. Added cameras, soil-moisture sensors, and energy management to the standard — the largest single expansion since launch.
- Matter 1.6 — Published June 2026. Extended coverage further into appliances and energy management.
The energy management additions in Matter 1.5 and 1.6 are the technically significant development for the major appliance industry. They enable real-time demand-response integration: a Matter-certified dishwasher or clothes dryer can receive a signal from a utility or home energy management system and defer a cycle automatically during grid stress events, without any homeowner action. That is the bridge between a “smart appliance” in the consumer marketing sense and a “grid-responsive asset” in the utility planning sense — the distinction that determines whether smart appliances generate recurring value or simply collect dust in the app drawer.
Jeff Aaron: Matter 1.6 extending into appliances and energy management in June 2026 is the protocol news that matters most for the next product cycle. A dishwasher that defers its start by two hours during a grid event — without the owner touching anything — is the device that earns a utility rebate, a lower-rate plan, and genuine month-twelve engagement. That is structurally different from a dishwasher that lets you set a timer from your phone. The question is whether manufacturers build the utility API integration into the firmware or treat it as a checkbox feature.
Privacy and Security in the Connected Appliance Base
Consumer Reports documented in May 2026 that connected appliances and IoT devices are frequently more vulnerable than phones and computers, in part because manufacturers building hardware on thin margins often do not prioritize security investment at the same level as software-first companies. A data breach at a Chinese IoT device manufacturer in early 2025 — involving a grow-light company, Mars Hydro — exposed billions of records, illustrating the scale of exposure possible from even non-major-appliance IoT devices.
The FTC has brought enforcement actions under Section 5 of the FTC Act against IoT device manufacturers whose security practices were inadequate, including TrendNet (security cameras), ASUS (routers), and Vizio (smart TVs). The same enforcement standard applies to connected appliance manufacturers — data collected from smart refrigerators, washers, and dishwashers is subject to the same unfair or deceptive trade practices standard as any other consumer IoT product.
Parks Associates reports that 72% of smart home product owners express concern about the security of personal data collected and transmitted by their connected devices. That concern does not typically block purchase decisions but does affect brand choice at equivalent price points — and it creates reputational exposure for manufacturers whose connected appliances experience security incidents.
Whirlpool’s 2024 10-K explicitly identifies cybersecurity risk in its connected appliance operations as a material strategic risk, noting that “our growth in the areas of direct-to-consumer sales and connected appliances (the ‘Internet of Things’) … has increased these risks.” The filing states that the company conducts annual mandatory global cybersecurity training for salaried employees and engages independent third-party consultants for tabletop preparedness exercises.
Jeff Aaron: The security support period question is the one manufacturers have not answered publicly. A connected dishwasher has a 10-to-12-year expected lifespan. A manufacturer who promises security updates through 2028 on a 2024 model is committing to patching a device for four years. What happens in year seven? No appliance brand has a published end-of-software-support date on its connected product pages. That is a transparency gap the FTC is likely to address, and the brands that get ahead of it will have a credible differentiation story.
Methodology
Data Collection
All primary sources were fetched and verified live during the August 2026 production session. No number in this article comes from model training memory.
Primary sources (hyperlinked in article):
- EIA RECS 2024 Table HC3.1 — U.S. Energy Information Administration, “Appliances in U.S. homes, by housing unit type, 2024,” preliminary release March 2026. Survey collected late 2024/early 2025; N ≈ 17,000 households, weighted to 132.54 million occupied primary U.S. residences. URL: https://www.eia.gov/consumption/residential/data/2024/hc/pdf/HC3.1_2024.pdf
- ASAP January 2026 Policy Analysis — Appliance Standards Awareness Project / ACEEE, “Appliance Efficiency Standards Lower Utility Bills and Cut Electricity Demand in Every State,” Joanna Mauer and Rachel Margolis, January 2026. URL: https://appliance-standards.org/sites/default/files/2026-01/Appliance-Efficiency-Standards-Lower-Bills-in-Every-State.pdf
- Whirlpool Corporation Form 10-K, FY2024 — SEC EDGAR, CIK 106640, filed January 29, 2025. URL: https://www.sec.gov/Archives/edgar/data/106640/000010664025000011/whr-20241231.htm
- EIA RECS 2024 Data Overview Page — U.S. Energy Information Administration. URL: https://www.eia.gov/consumption/residential/data/2024/index.php?view=characteristics
- Consumer Reports, “Smart Appliances Are Everywhere. So Are the Privacy Risks,” May 2026. URL: https://www.consumerreports.org/electronics/data-theft/tips-data-protection-privacy-smart-devices-a4910202450/
Non-primary sources (cited in plain text only, not hyperlinked):
- Parks Associates (72% smart home product owner data security concern rate) — cited via Consumer Reports May 2026 article
- CSA Matter standard version history (Matter 1.0, 1.3, 1.5, 1.6 dates) — csa-iot.org
- DOE ENERGY STAR program planning documents (Clothes Dryers Specification V1.1/V2.0 timeline) — energystar.gov
Calculations
All penetration rates (Tables 1 and 2) are Axis Intelligence Research calculations from EIA RECS 2024 HC3.1 raw counts divided by 132.54 million total primary residences. All ASAP figures (Table 3) are reproduced directly from the January 2026 source document. The SAREI index formula and component calculations are disclosed in full above; Python arithmetic verification was run on all figures prior to writing.
Scope
EIA RECS 2024 housing characteristics and appliance data are preliminary (March 2026 release). Consumption and expenditure tables — which will allow energy use per appliance per household — are scheduled for spring 2027. That release will enable a more precise component B calculation for SAREI and will trigger a full article update.
About This Dataset
This article’s underlying dataset covers U.S. household appliance penetration across 132.54 million primary residences (EIA RECS 2024), per-state utility bill savings from federal appliance efficiency standards (ASAP January 2026 analysis, 2016–2025 decade), the Axis SAREI baseline index reading, and key Whirlpool Corporation financial data from its SEC 10-K (FY2024).
Creator and publisher: Axis Intelligence Research (axis-intelligence.com)
License: CC BY 4.0 — attribution required: Axis Intelligence Research, “Smart Appliance Statistics 2026,” August 2026
Temporal coverage: Survey data collected late 2024/early 2025 (EIA RECS); standards savings covering 2016–2025; SAREI baseline August 2026
Spatial coverage: United States (EIA RECS, ASAP, Whirlpool 10-K Americas); Global (Whirlpool 10-K)
Dataset download: smart-appliance-statistics.csv
Cite this page:
- APA: Axis Intelligence Research & Aaron, J. (2026). Smart Appliance Statistics 2026: U.S. Penetration, Energy Impact & Industry Data. axis-intelligence.com/smart-appliance-statistics/
- MLA: Axis Intelligence Research and Jeff Aaron. “Smart Appliance Statistics 2026.” Axis Intelligence Research, 22 Aug. 2026, axis-intelligence.com/smart-appliance-statistics/.
- Chicago: Axis Intelligence Research and Jeff Aaron. “Smart Appliance Statistics 2026: U.S. Penetration, Energy Impact & Industry Data.” Axis Intelligence Research, August 22, 2026. axis-intelligence.com/smart-appliance-statistics/.
Frequently Asked Questions
What percentage of U.S. homes have a dishwasher in 2024?
According to the EIA’s 2024 Residential Energy Consumption Survey (preliminary release, March 2026), 99.47 million of the 132.54 million occupied primary U.S. residences have a dishwasher — a penetration rate of 75.0%. Penetration is substantially higher in single-family detached homes than in multi-unit apartment buildings, where renters typically cannot select their own appliances.
How much does a typical U.S. household save per year from appliance efficiency standards?
The Appliance Standards Awareness Project’s January 2026 policy analysis found that the average U.S. household would have paid $6,115 more on utility bills over the decade 2016–2025 — approximately $612 per year — absent existing federal appliance efficiency standards. The per-state range runs from $4,646 (North Dakota) to $11,446 (Hawaii), driven primarily by differences in local electricity and water rates.
What is the SAREI and what does a score of 62.56 mean?
The Smart Appliance Readiness and Energy Impact Index (SAREI) is an Axis Intelligence Research composite metric. The 2024 baseline reading of 62.56 reflects near-universal core appliance penetration (component A: 87.84%), meaningful but not maximal efficiency savings as a share of the average electricity bill (component B: 33.0%), and a connected small-appliance layer that has reached substantial but not saturated scale (component C: 43.7% weekly air-fryer penetration). The formula is [(A × 0.50) + (B × 0.30) + (C × 0.20)] × 100.
What is the fastest-growing appliance category in U.S. homes?
Based on EIA RECS 2024 data, the air fryer is the most rapidly expanding tracked category: 57.93 million households report weekly use — 43.7% of all primary residences — exceeding the outdoor grill rate (52.6%) in some age demographics and far ahead of the slow cooker (27.2%) and rice cooker (17.3%).
How old is the average U.S. refrigerator?
The modal age bucket in EIA RECS 2024 is 5 to 9 years old (43.36 million homes, 32.8% of refrigerator-owning households). But 35.27 million homes (26.7%) have a primary refrigerator that is 10 or more years old, and 6.29 million homes (4.8%) have one that is 20 or more years old.
How many U.S. homes have two or more refrigerators?
According to EIA RECS 2024 (Table HC3.1), 45.47 million U.S. homes — 34.3% of all occupied primary residences — have two or more refrigerators. The second unit is most commonly located in the garage (20.02 million homes) or elsewhere in the home (13.95 million homes).
What fuel does the majority of U.S. ranges run on?
Electric is the dominant fuel: 68.56 million of the 115.92 million range-owning homes use electric as the fuel for their primary range — 59.1%. Natural gas follows at 31.7% (36.75 million homes), with dual-fuel (5.0%) and propane (4.1%) rounding out the balance. All figures from EIA RECS 2024 Table HC3.1.
Are connected appliances a security risk?
Consumer Reports documented in May 2026 that connected home appliances are frequently more vulnerable than phones and computers. The FTC has brought Section 5 enforcement actions against IoT device manufacturers with inadequate security practices. Whirlpool’s 2024 SEC 10-K lists connected appliance cybersecurity as a material strategic risk. Parks Associates reports that 72% of smart home product owners express concern about data collection from their connected devices.