

AR Glasses Statistics 2026
By Axis Intelligence Research
Co-author: Alex Rivera | Last updated: September 28, 2026 | License: CC BY 4.0
Display glasses — true AR glasses with an image in the lens — reached 14.3% of global XR shipments in Q2 2026, up from 11% a year earlier, per IDC. Axis Intelligence Research finds the Axis Display Penetration Index (ADPI) reads 16.9 in its baseline Q2 2026 reading: roughly one in six glasses shipped now carries a display.
Quick Answer
AR glasses are the fastest-growing corner of the eyewear market but still a minority of it. IDC forecasts 3.0 million optical see-through display glasses in 2026, rising to 12.2 million by 2030 (41.9% CAGR). Counterpoint reports AR and AI glasses shipments rose 449% year over year in H1 2026, led by Rokid (41%) and Meta (37%). Axis Intelligence Research estimates display glasses will generate $1.55–1.64 billion in 2026.
Key Findings
- Axis Intelligence Research finds the Axis Display Penetration Index (ADPI) stood at 16.9 in Q2 2026 — display glasses were 16.9% of all glasses shipped, per IDC shipment shares.
- Axis Intelligence Research finds display glasses shipped 0.93 units for every VR/MR headset in Q2 2026, up from 0.41 a year earlier — the two categories are now within 1.1 share points of each other.
- Axis Intelligence Research estimates optical see-through AR glasses will generate $1.55–1.64 billion in 2026, about a quarter of all smart-glasses revenue, based on IDC unit and ASP forecasts.
- Axis Intelligence Research finds the price premium for a display widens from 1.37–1.45× in 2026 to 2.25–2.39× by 2030, because IDC expects display-less prices to fall and display-glasses prices to hold.
- Axis Intelligence Research finds IDC’s current trajectory implies about 8.57 million display glasses in 2029 — roughly 2.04 times the 4.2 million S&P Global Market Intelligence forecast in September 2025.
What Counts as AR Glasses? (And Why the Numbers Disagree)
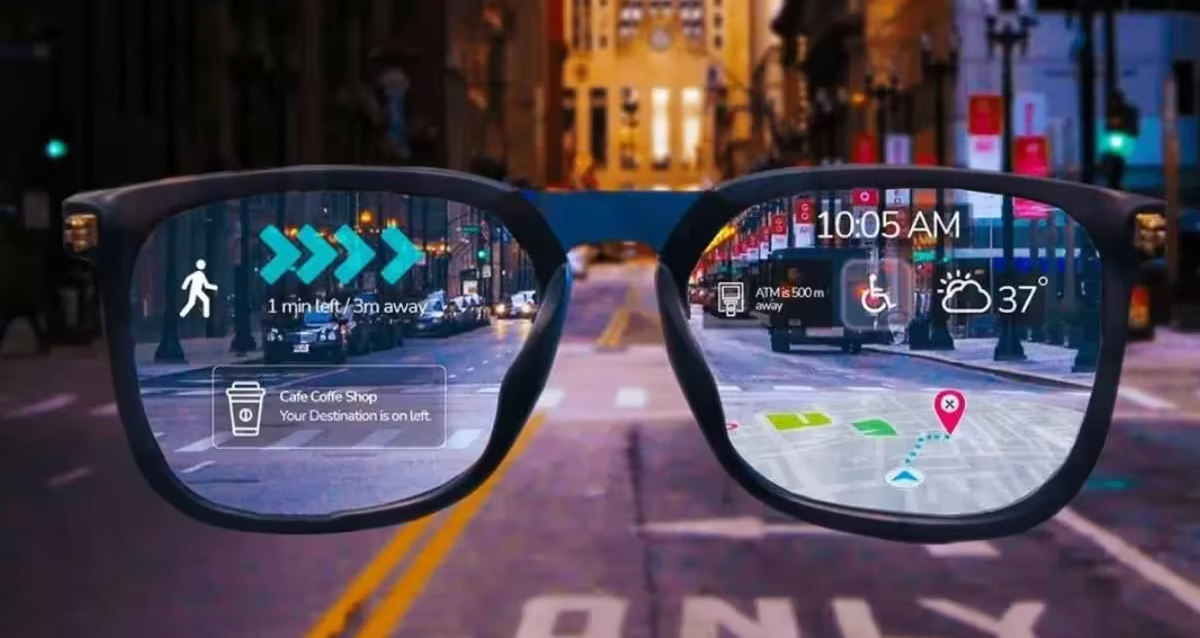
AR glasses are eyewear that projects digital images onto a see-through lens so the wearer sees information over the real world. That separates them from display-less smart glasses (camera, microphones, speakers, AI assistant — Ray-Ban Meta is the archetype) and from VR/MR headsets, which block or pass through the view.
Every tracker draws the border slightly differently, and that explains most “conflicting” AR statistics you will see quoted:
| Tracker | What it calls the display segment | What it includes | Source |
|---|---|---|---|
| IDC | Optical see-through (OST) display glasses / “display glasses” | Birdbath, flat-prism and waveguide glasses (XREAL, Viture, RayNeo, Meta Ray-Ban Display) | IDC, June 2026 |
| Counterpoint (quarterly) | AR glasses | Birdbath/flat-prism “media viewers” + waveguide AR | Counterpoint Research |
| Counterpoint (H1 2026 AI study) | AR & AI glasses | Only AI glasses with an optical see-through display — excludes pure media viewers | Counterpoint Research |
The practical rule: use IDC for unit forecasts and share-of-market math, Counterpoint for optics mix and vendor rankings inside a segment. Axis Intelligence Research never averages the two.
Alex Rivera’s read: When a headline says “AR glasses grew 449%” and another says “136%,” neither is wrong. One counts only glasses with an AI assistant and a see-through display; the other also counts the video glasses people plug into a Switch on a plane. Before you buy — or cite — check which product you’re actually talking about.
How Many AR Glasses Are Shipped? 2026–2030 Forecast
IDC forecasts optical see-through display glasses rising from 3.0 million units in 2026 to 12.2 million in 2030, a 41.9% compound annual growth rate — the fastest-growing XR segment in its outlook (IDC). Axis Intelligence Research re-ran the math: (12.2 ÷ 3.0)^(1/4) − 1 = 42.0%, consistent with IDC’s stated rate.
AR glasses vs other XR device forecasts
| Segment | 2026 forecast | 2030 forecast | Growth | Source |
|---|---|---|---|---|
| Optical see-through display glasses | 3.0M | 12.2M | 41.9% CAGR | IDC |
| Display-less smart glasses | 13.6M | 27.3M | — | IDC |
| Mixed reality headsets | 3.2M | 10.4M | — | IDC |
| Total XR (headsets + glasses), unit growth | +26.3% (2026) | +40.5% (2027), +26.4% (2028) | — | IDC, Sept 2026 |
For context on the base year, IDC’s last full-year view put 2025 XR shipments — headsets plus all glasses — at 14.5 million, with XR glasses forecast to grow at a 29.3% CAGR through 2029 (IDC, Dec 2025). [older data] — IDC has not yet published a 2026 full-year total.
Where forecasters disagree on AR glasses
In September 2025, S&P Global Market Intelligence forecast 1.2 million display-based smart glasses in 2025, growing to 4.2 million in 2029 — and flagged that an aggressive Apple or Samsung entry would make that too pessimistic.
Extend IDC’s 2026 base at its own CAGR and 2029 lands near 8.57 million (3.0 × 1.419³). Axis Intelligence Research estimates that path runs 2.04× the S&P figure. The scopes and vintages differ, so we publish both rather than merging them. But the direction of revision since late 2025 has been upward, and S&P’s own caveat named exactly the entrants now shipping on Android XR.
Alex Rivera’s read: A doubling between two serious forecasters tells you the display glasses market hasn’t found its price point yet. That’s the real uncertainty — not whether people want information in their lens, but at what cost they’ll accept the extra weight and the shorter battery.
The Axis Display Penetration Index (ADPI)
Growth rates on a small base flatter everything. The question professionals actually need answered is simpler: of all the glasses the world ships, how many have a display? Axis Intelligence Research built the ADPI to track exactly that.
ADPI = display glasses ÷ (display glasses + display-less glasses) × 100, using a single tracker’s shares or units in the same period, so the methodology on both sides of the fraction matches.
ADPI readings
| Period | Display glasses | Display-less glasses | ADPI | Basis |
|---|---|---|---|---|
| Q2 2025 | 11.0% of XR | 61.9% of XR | 15.1 | IDC XR shipment mix |
| Q2 2026 (baseline reading) | 14.3% of XR | 70.3% of XR | 16.9 | IDC XR shipment mix |
| 2026 forecast (ADPI-F) | 3.0M units | 13.6M units | 18.1 | IDC forecast |
| 2030 forecast (ADPI-F) | 12.2M units | 27.3M units | 30.9 | IDC forecast |
Sources: IDC Q2 2026; IDC forecast. Q2 2026 is the ADPI’s baseline reading; the Q2 2025 value is a back-calculation from the same IDC release.
How to read it. An ADPI of 16.9 means about one in six glasses shipped carries an in-lens display. IDC’s forecast takes that to nearly one in three by 2030 — a 12.8-point rise. A rising ADPI while display-less glasses are also growing means display glasses are outgrowing a market that is itself booming.
What would move it. Two things: display glasses launched at audio-glasses prices (the ADPI jumps), or a component-yield problem on waveguides that caps display supply while cheap camera glasses flood retail (the ADPI stalls). Counterpoint already cited yield limits on Meta Ray-Ban Display components in Q1 2026 — the second scenario is not hypothetical.
Counterpoint’s narrower lens gives a much lower number: AR & AI glasses were 4% of AI-glasses shipments in H1 2026 (100% − 96% display-less). That figure excludes birdbath media viewers, which is why it sits far below the IDC-based ADPI. Axis Intelligence Research reports both, labeled, and uses the IDC basis for the index.
Alex Rivera’s read: If you’re choosing between a camera pair and a display pair today, the ADPI says you’re in the minority either way you go display — but a growing one. Display glasses are no longer a developer kit. They’re a retail product one buyer in six picks.
AR Glasses vs VR Headsets: Which Ships More?
Display glasses and VR/MR headsets are now almost level. In Q2 2026, IDC put display glasses at 14.3% of XR shipments and headsets at 15.4%. A year earlier, headsets held 27.1% (Axis calculation: 100 − 61.9 − 11.0) against 11% for display glasses.
| Period | Display glasses share | Headsets share | Display glasses per headset | Source |
|---|---|---|---|---|
| Q2 2025 | 11.0% | 27.1% | 0.41 | IDC; Axis calculation |
| Q2 2026 | 14.3% | 15.4% | 0.93 | IDC; Axis calculation |
Axis Intelligence Research finds the ratio more than doubled in twelve months. Counterpoint’s Q1 2026 growth split points the same way: AR glasses +136%, VR headsets −17% (Counterpoint Research). On current momentum, display glasses overtaking headsets in a quarterly IDC mix is the next milestone to watch — a crossover the data does not yet show.
Alex Rivera’s read: This is the chart that should worry anyone still building for the headset form factor. The screen is migrating from a box on your face to a lens you wear on the train.
Who Leads the AR Glasses Market? Market Share by Brand
There is no single AR glasses leaderboard — there are three, and they reward different product strategies.
AR & AI glasses (display + AI assistant), H1 2026
| Vendor | Share | Source |
|---|---|---|
| Rokid | 41% | Counterpoint Research |
| Meta | 37% | Counterpoint Research |
| Even Realities | 11% | Counterpoint Research |
| Alibaba | 7% | Counterpoint Research |
| INMO | 2% | Counterpoint Research |
| Others | 2% | Counterpoint Research |
The segment grew 449% year over year and 18% half on half (Counterpoint Research, Sept 2026). Contrast that with display-less AI glasses, where Meta held 94%. Meta’s grip on camera glasses does not carry over to display glasses — four of the top five AR & AI vendors are Chinese.
Birdbath / flat-prism AR glasses (media viewers), Q1 2026
| Vendor | Share | Note | Source |
|---|---|---|---|
| RayNeo | 41% | Segment leader | Counterpoint Research |
| VITURE | 34% | Shipments +281% YoY | Counterpoint Research |
Waveguide AR glasses, Q1 2026
| Vendor | Share | Source |
|---|---|---|
| Rokid | Ranked #1 (share not disclosed) | Counterpoint Research |
| Meta | 38% | Counterpoint Research |
| Even Realities | 9% | Counterpoint Research |
| Alibaba | 5% | Counterpoint Research |
Display glasses brands inside IDC’s XR ranking, Q2 2026
In IDC’s all-XR vendor table, the display-glasses specialists sit just behind Meta (68.7%): RayNeo 3.6% (shipments +83.3% YoY), Alibaba Group 2.6%, XREAL 2.5%, Xiaomi 2.3% (IDC).
Alex Rivera’s read: Rokid over Meta in display AI glasses is the most underreported number in consumer tech this year. Meta sells more glasses than anyone, but in the product category everyone says is the future, a company most Western buyers haven’t heard of is ahead — partly because Meta couldn’t build Ray-Ban Display fast enough.
Waveguide vs Birdbath: How Is AR Glasses Technology Shifting?
The optics inside AR glasses are changing faster than the brands on the box. Waveguides — thin, glass-like lenses that look closer to normal eyewear — went from a fifth of AR shipments to two-fifths in a year.
| Period | Waveguide share of AR glasses | Birdbath / flat-prism share | Source |
|---|---|---|---|
| Q1 2025 | 18% | 82% | Counterpoint Research |
| Q2 2025 | 20% | — | Counterpoint Research |
| Q1 2026 | 42% | 58% | Counterpoint Research |
| Q2 2026 | ~40% | 60% | Counterpoint Research |
Axis Intelligence Research finds waveguide share rose 24 points year over year in Q1 2026 and 20 points in Q2 2026, then plateaued as new birdbath media viewers (RayNeo GT series, XREAL) launched. The plateau matters: waveguides win on looks and all-day wear, birdbath wins on screen size and cost, and the market is currently buying both.
On the supply side, EssilorLuxottica started a strategic partnership with Applied Materials in H1 2026 focused on new generations of intelligent optical systems (EssilorLuxottica) — the world’s largest eyewear group betting on waveguide manufacturing capacity.
How Much Do AR Glasses Cost in 2026?
IDC expects optical see-through display glasses to hold an ASP of $516–547 through 2030, with the most sophisticated spatial-computing hardware selling above $1,000. Display-less smart glasses, by contrast, average about $376 in 2026 and fall toward $229 by 2030 (IDC).
The display premium
| Measure | 2026 | 2030 | Basis |
|---|---|---|---|
| Display glasses ASP | $516–547 | $516–547 | IDC |
| Display-less glasses ASP | $376 | $229 | IDC |
| Display premium multiple | 1.37–1.45× | 2.25–2.39× | Axis calculation |
| Meta Ray-Ban Display list price | $799 (incl. Neural Band) | — | Meta |
| Meta Ray-Ban Display vs IDC display-less ASP | 2.13× | — | Axis calculation |
Axis Intelligence Research finds the premium for putting a screen in the lens widens over the forecast period. That is the opposite of what most buyers assume: IDC sees camera glasses commoditizing while display glasses hold price because the optics stay expensive.
Meta Ray-Ban Display, priced from $799 with its EMG wristband, offers up to six hours of mixed-use battery; the Neural Band runs up to 18 hours and was trained on data from nearly 200,000 research participants (Meta). At Connect 2026, Meta added online ordering and five new countries — the UK, Canada, France, Italy and Germany (Meta).
Alex Rivera’s read: Don’t wait for display glasses to hit camera-glasses prices — on IDC’s numbers, they won’t this decade. If you want a screen in your lens, the decision is whether the $500–800 tier does enough for you now. If you mainly want photos and an assistant, the cheaper pair keeps getting cheaper.
How Big Is the AR Glasses Market in Revenue?
IDC publishes unit and ASP forecasts for display glasses but not a revenue line. Axis Intelligence Research estimates display-glasses revenue by multiplying the two:
- 2026: 3.0M × $516–547 = $1.55–1.64 billion
- 2030: 12.2M × $516–547 = $6.30–6.67 billion
Against IDC’s $5.1 billion 2026 revenue forecast for display-less glasses, display glasses would be 23.3–24.3% of combined glasses revenue — roughly one dollar in four from about one unit in six. That is the economic case for display glasses in one line: a minority of volume, an outsized share of value.
These are Axis estimates, not IDC figures. IDC states a single ASP range across 2026–2030 rather than per-year values, so both ends of the range are applied to each year.
Where Are AR Glasses Sold? Regional Split
AR glasses are a China-and-North-America market. In H1 2026, China took 45% of AR & AI glasses shipments, North America 41%, and the rest of the world 14% (Counterpoint Research). That is a sharp contrast with display-less AI glasses, where North America and Western Europe dominate.
| Region | AR & AI glasses share, H1 2026 | Source |
|---|---|---|
| China | 45% | Counterpoint Research |
| North America | 41% | Counterpoint Research |
| Rest of world | 14% | Counterpoint Research |
Counterpoint attributes China’s lead to a mature local supply chain — micro-display makers, waveguide suppliers and assemblers in close proximity — which lets Chinese vendors launch earlier and iterate faster. For Europe, the practical constraint has been availability: Meta Ray-Ban Display only reached the UK, France, Italy and Germany in September 2026.
Enterprise AR Glasses: What the Data Supports
IDC expects a price split: enterprise buyers will pay for sophisticated spatial hardware (above $1,000) to offset other costs and raise productivity, while consumers gravitate to mid-priced products with simpler use cases. IDC also reports tracking ROI gains in early enterprise pilots in training and design, and says more businesses keep starting them (IDC).
What no primary source publishes yet is an enterprise AR glasses unit count or deployment rate. We have left that number out rather than approximate it; it enters this dataset when a tracker with disclosed methodology publishes it.
Frequently Asked Questions: AR Glasses Data
What share of smart glasses sold in 2026 have a display?
About one in six. Axis Intelligence Research’s ADPI puts display glasses at 16.9% of all glasses shipped in Q2 2026, based on IDC shipment shares. IDC’s forecast implies 18.1% for full-year 2026 and 30.9% by 2030.
Are AR glasses outselling VR headsets yet?
Not quite. In Q2 2026, IDC put display glasses at 14.3% of XR shipments and VR/MR headsets at 15.4%. Axis Intelligence Research calculates 0.93 display glasses shipped per headset, up from 0.41 a year earlier.
Which company sells the most AR glasses with AI?
Rokid. Counterpoint Research reports Rokid held 41% of AR & AI glasses shipments in H1 2026, ahead of Meta at 37%, Even Realities at 11% and Alibaba at 7%.
Why is Meta not dominant in AR glasses like it is in camera glasses?
Supply, not demand. Counterpoint reports Meta held 94% of display-less AI glasses in H1 2026, but its Ray-Ban Display growth was constrained by component production yields and limited US availability in Q1 2026.
Will AR glasses get cheaper?
Slowly, if at all. IDC forecasts display glasses holding a $516–547 average price through 2030, while display-less glasses fall to about $229. Axis Intelligence Research finds the display premium widens from about 1.4× to about 2.3×.
Are waveguide AR glasses replacing birdbath designs?
Partly. Waveguides rose from 18% to 42% of AR glasses shipments between Q1 2025 and Q1 2026, per Counterpoint, then held around 40% in Q2 2026 as new birdbath media viewers launched.
How big will the AR glasses market be in 2030?
IDC forecasts 12.2 million optical see-through display glasses in 2030. Axis Intelligence Research estimates that volume at $516–547 per unit equals $6.30–6.67 billion in revenue.
Why do AR glasses growth rates vary so much between reports?
Different definitions. Counterpoint’s 449% (H1 2026) counts only AI glasses with a see-through display; its 136% (Q1 2026) includes media-viewer AR glasses; IDC’s 86% (Q1 2026) covers all display eyewear, headsets included.
Methodology
Collection. Axis Intelligence Research compiled this dataset on September 27, 2026 from primary sources opened during production: IDC blog releases (June 15 and September 16, 2026) and press release (December 11, 2025); Counterpoint Research releases (June 24, September 9 and September 21, 2026); Meta newsroom posts (September 17, 2025 and September 24, 2026); EssilorLuxottica’s Q2/H1 2026 results (July 28, 2026); and S&P Global Market Intelligence research (September 26, 2025). Where Counterpoint’s release pages render segment tables in a format our tools could not extract, segment figures were confirmed against at least one independent report of the same release, and the CSV notes this per row.
Axis-calculated figures and formulas.
- ADPI (Axis Display Penetration Index): display glasses ÷ (display glasses + display-less glasses) × 100, same tracker, same period. Q2 2026 is the baseline reading. ADPI-F applies the same formula to IDC unit forecasts.
- Display-to-headset ratio: IDC display glasses share ÷ IDC headset share, same quarter. Q2 2025 headset share = 100 − 61.9 − 11.0.
- Display premium multiple: IDC display-glasses ASP ÷ IDC display-less ASP, same year.
- Display-glasses revenue estimate: IDC unit forecast × IDC ASP range (low and high).
- 2029 path estimate: IDC 2026 display-glasses forecast × 1.419³.
- Waveguide share change: Counterpoint share, current period minus year-ago period.
What we did not merge. IDC and Counterpoint segment definitions; Counterpoint’s quarterly AR glasses and its H1 AR & AI glasses category; IDC and S&P forecasts. Each is shown side by side with its scope labeled. All forecasts are the forecaster’s own; Axis figures are labeled as findings (direct calculation from reported shares) or estimates (projections or unit × price).
About This Dataset
ar-glasses-statistics.csv contains 101 rows covering AR and display-glasses shipments, forecasts, vendor shares by segment, optics mix, regional split, prices, and every Axis-calculated figure with its formula. Each row carries value, unit, as-of date, geography, segment, vendor, source organization, source document, source URL, retrieval date, primary-source flag and, for calculated rows, a method note.
Updates are relevance-driven: the dataset is refreshed when IDC or Counterpoint publishes a new quarterly glasses mix, when a major display-glasses launch changes pricing, or when a new full-year forecast appears. Each update adds a dated ADPI reading.
License: CC BY 4.0. Citation line: Axis Intelligence Research, AR Glasses Statistics 2026, 2026.
Cite This Page
APA: Axis Intelligence Research, & Rivera, A. (2026). AR glasses statistics 2026: Display glasses shipments, market share, prices & the Axis Display Penetration Index. Axis Intelligence. https://axis-intelligence.com/ar-glasses-statistics/
MLA: Axis Intelligence Research, and Alex Rivera. “AR Glasses Statistics 2026: Display Glasses Shipments, Market Share, Prices & the Axis Display Penetration Index.” Axis Intelligence, 27 Sept. 2026, axis-intelligence.com/ar-glasses-statistics/.
Chicago: Axis Intelligence Research, and Alex Rivera. “AR Glasses Statistics 2026: Display Glasses Shipments, Market Share, Prices & the Axis Display Penetration Index.” Axis Intelligence, September 27, 2026. https://axis-intelligence.com/ar-glasses-statistics/.
Related Axis Intelligence Research pages: smart glasses statistics — shipments, Meta’s share and the concentration index · multimodal AI cost per token · Virtual Reality Statistics