

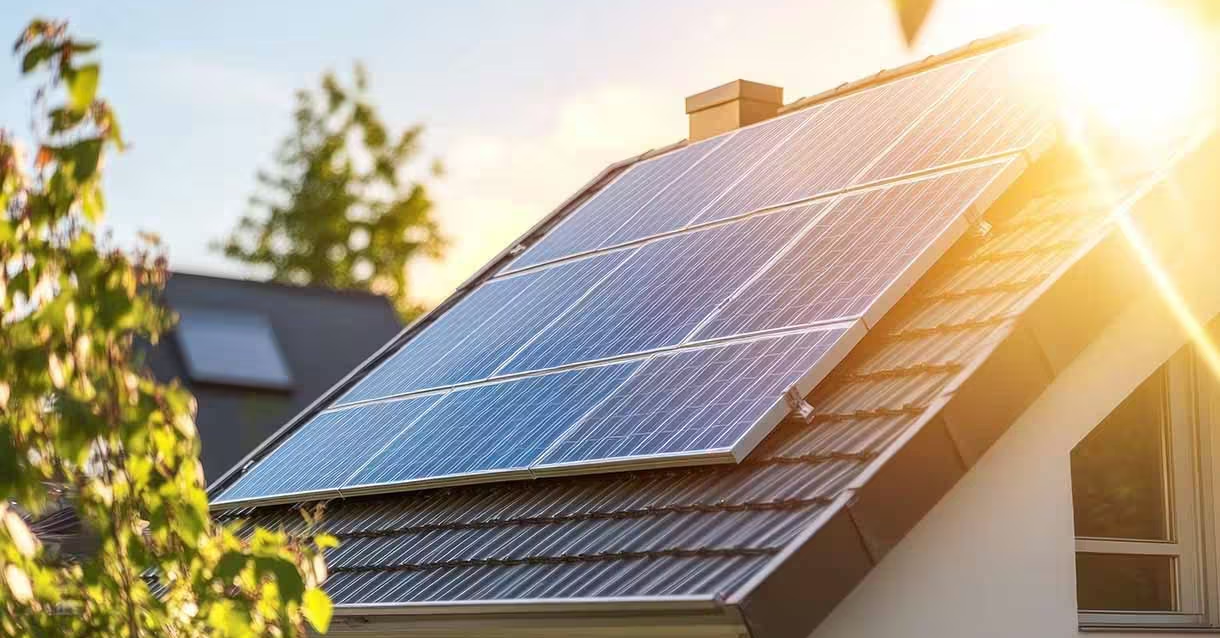
Install Solar Panels Cost 2026
By Axis Intelligence Research
Co-author: Aidan Jad | Last updated: October 1 | License: CC BY 4.0
Prices verified on October 1, 2026. Every installed price on this page comes from Lawrence Berkeley National Laboratory’s project-level data on systems installed in 2025. Every electricity rate comes from the U.S. Energy Information Administration’s July 2026 release. No vendor quote, lead form or advertised “starting at” price is used anywhere.
The median American homeowner who bought a stand-alone rooftop solar system in 2025 paid $3.6 per watt before incentives, according to Lawrence Berkeley National Laboratory. At the 2025 median residential system size of 7.7 kW, Axis Intelligence Research estimates that comes to about $27,720. Homeowners who paid cash paid less, at $3.0/W, and loan buyers paid more, at $4.5/W.
Quick Answer: What Does It Cost to Install Solar Panels?
Installed residential solar cost a median $3.6/W in 2025, down $0.5/W from 2024 in real terms (Berkeley Lab, August 2026). Across the 16 states with enough data, medians ran from $3.0/W in Washington to $4.1/W in North Carolina and New Mexico. Adding a battery raised the median to $4.9/W. The 30% federal credit ended for systems completed after December 31, 2025.
Key Findings
- According to Lawrence Berkeley National Laboratory, the median installed price for host-owned residential solar fell from $4.1/W in 2024 to $3.6/W in 2025, in 2025 dollars.
- Axis Intelligence Research estimates a median-size 7.7 kW system cost about $23,100 when paid in cash and about $34,650 when financed with a loan, a gap of roughly $11,550 before interest.
- Axis Intelligence Research finds California has the lowest Grid Kilowatt-hours per Watt (WGK™) reading of 16 states, at 9.8: one installed watt costs as much as 9.8 kWh of grid power.
- North Carolina has the highest WGK™ reading, at 27.0, because its $4.1/W median installed price meets a residential rate of just 15.16¢/kWh (EIA, July 2026).
- Median prices across the top 100 U.S. residential installers ranged from $2.4/W to $6.3/W in 2025, according to Berkeley Lab — a wider spread than the gap between any two states.
Install Solar Panels Cost by State: Median Price per Watt in 2026
Berkeley Lab publishes state medians only where it holds at least 20 priced systems, which produced 16 states for 2025 installs. Those 16 include California, which supplies roughly half of the residential sample, along with Texas, Florida, New York, New Jersey, Massachusetts and Arizona. The figures below are the gross price paid by the system owner, before any incentive or tax credit, for host-owned, stand-alone PV. Leases and power purchase agreements are excluded because their customers don’t pay an up-front price.
The “estimated system price” column applies each state’s median $/W to the 2025 national median size of 7.7 kW. It shows what a typical-size system costs at that state’s going rate, not the median bill in that state.
Solar Panel Installation Cost per Watt by State (2025 Installs)
| State | Median installed price ($/W) | Estimated price, 7.7 kW system | Source |
|---|---|---|---|
| Washington | $3.0 | $23,100 | Berkeley Lab; Axis estimate |
| Arizona | $3.1 | $23,870 | Berkeley Lab; Axis estimate |
| Florida | $3.1 | $23,870 | Berkeley Lab; Axis estimate |
| Connecticut | $3.3 | $25,410 | Berkeley Lab; Axis estimate |
| California | $3.3 | $25,410 | Berkeley Lab; Axis estimate |
| Massachusetts | $3.4 | $26,180 | Berkeley Lab; Axis estimate |
| Oregon | $3.4 | $26,180 | Berkeley Lab; Axis estimate |
| Rhode Island | $3.5 | $26,950 | Berkeley Lab; Axis estimate |
| New Hampshire | $3.7 | $28,490 | Berkeley Lab; Axis estimate |
| New Jersey | $3.7 | $28,490 | Berkeley Lab; Axis estimate |
| Wisconsin | $3.9 | $30,030 | Berkeley Lab; Axis estimate |
| New York | $3.9 | $30,030 | Berkeley Lab; Axis estimate |
| Maryland | $4.0 | $30,800 | Berkeley Lab; Axis estimate |
| Texas | $4.0 | $30,800 | Berkeley Lab; Axis estimate |
| North Carolina | $4.1 | $31,570 | Berkeley Lab; Axis estimate |
| New Mexico | $4.1 | $31,570 | Berkeley Lab; Axis estimate |
| United States | $3.6 | $27,720 | Berkeley Lab; Axis estimate |
Prices in 2025 dollars per watt DC. Source: Berkeley Lab, U.S. Distributed Solar and Storage: 2026 Data Update, August 2026. System estimates by Axis Intelligence Research.
The top-to-bottom spread is $1.1/W. On a 7.7 kW roof, Axis Intelligence Research calculates that is about $8,470 — the price of choosing Raleigh over Seattle before a single panel is specced.
Texas is the case worth noticing. It is one of the largest residential markets in the country, yet its median sits at $4.0/W, well above California’s $3.3/W. Market size alone does not make a state cheap.
Analyst commentary — Aidan Jad: The cheap states aren’t cheap because the panels are different. Modules are a global commodity, and Berkeley Lab attributes roughly 80% of the installed price to soft costs and balance-of-system hardware. That covers customer acquisition, labor, permitting, interconnection, financing fees and margin. A $1.1/W gap between Washington and North Carolina is a gap in how the sale is made and financed, not in the hardware on the roof.
Why are only 16 states listed?
Berkeley Lab reports a state median only when at least 20 priced, host-owned systems are on file, and installed-price fields come from utility and state-agency program records. Many states don’t collect prices at all. Axis Intelligence Research did not fill the gaps with quote-site averages or modeled figures. A state without a measured median is a state without a number on this page.
Is Solar Worth It in My State? The Grid Kilowatt-hours per Watt (WGK™)
A price per watt tells you what solar costs. It doesn’t tell you what solar costs relative to the power it replaces, and that is the comparison homeowners are actually making. A $3.3/W system in California and a $3.3/W system in Connecticut are not the same purchase when one state’s utility charges 33.61¢/kWh and the other 24.16¢/kWh.
The Grid Kilowatt-hours per Watt (WGK™) is an original Axis Intelligence Research metric. It answers one question: how many kilowatt-hours of grid electricity does the price of one installed solar watt buy?
Formula: WGK™ = state median installed price ($/W) ÷ state average residential electricity price ($/kWh)
- Input 1: median installed price for host-owned, stand-alone residential PV, 2025 installs (Berkeley Lab, August 2026).
- Input 2: average residential electricity price, July 2026 (EIA Electric Power Monthly, Table 5.6.A), converted from cents to dollars.
- Reading: lower is better for the buyer. A low WGK™ means each installed watt displaces expensive grid power, so the purchase pays for itself in fewer units of avoided electricity.
Worked example (California): $3.3/W ÷ $0.3361/kWh = 9.8 kWh per watt.
WGK™ by State, 2026
| Rank | State | Median $/W (2025) | Residential rate, July 2026 (¢/kWh) | WGK™ (kWh per watt) | Source |
|---|---|---|---|---|---|
| 1 | California | $3.3 | 33.61 | 9.8 | Berkeley Lab; EIA; Axis |
| 2 | Massachusetts | $3.4 | 30.49 | 11.2 | Berkeley Lab; EIA; Axis |
| 3 | Rhode Island | $3.5 | 28.29 | 12.4 | Berkeley Lab; EIA; Axis |
| 4 | New York | $3.9 | 29.90 | 13.0 | Berkeley Lab; EIA; Axis |
| 5 | Connecticut | $3.3 | 24.16 | 13.7 | Berkeley Lab; EIA; Axis |
| 6 | New Hampshire | $3.7 | 26.60 | 13.9 | Berkeley Lab; EIA; Axis |
| 7 | New Jersey | $3.7 | 25.19 | 14.7 | Berkeley Lab; EIA; Axis |
| 8 | Maryland | $4.0 | 21.41 | 18.7 | Berkeley Lab; EIA; Axis |
| — | United States | $3.6 | 18.31 | 19.7 | Berkeley Lab; EIA; Axis |
| 9 | Arizona | $3.1 | 15.38 | 20.2 | Berkeley Lab; EIA; Axis |
| 10 | Washington | $3.0 | 14.71 | 20.4 | Berkeley Lab; EIA; Axis |
| 11 | Wisconsin | $3.9 | 19.06 | 20.5 | Berkeley Lab; EIA; Axis |
| 12 | Florida | $3.1 | 15.03 | 20.6 | Berkeley Lab; EIA; Axis |
| 13 | Oregon | $3.4 | 15.97 | 21.3 | Berkeley Lab; EIA; Axis |
| 14 | Texas | $4.0 | 15.88 | 25.2 | Berkeley Lab; EIA; Axis |
| 15 | New Mexico | $4.1 | 16.09 | 25.5 | Berkeley Lab; EIA; Axis |
| 16 | North Carolina | $4.1 | 15.16 | 27.0 | Berkeley Lab; EIA; Axis |
WGK™ calculated by Axis Intelligence Research, October 1, 2026. Licensed CC BY 4.0.
The ranking turns the price table upside down. Washington has the cheapest installs in the country and ranks tenth, because its grid power is cheap too. California sits mid-table on price and first on WGK™: at California retail rates, the price of a watt buys under 10 kWh of grid electricity. In North Carolina, the same watt costs as much as 27 kWh.
The Northeast clusters at the top. Seven of the eight states below the national WGK™ of 19.7 are on the Eastern Seaboard, and every one of them pays more than 21¢/kWh for residential power.
Analyst commentary — Aidan Jad: WGK™ is a ratio, not a payback period, and I’d rather say so plainly than dress it up. It leaves out how many kWh a watt actually produces, which depends on latitude, roof pitch and shading. It also leaves out how a utility credits exported power, which in California changed under net billing. What it does capture is the part most cost pages skip: the sticker price only means something next to the rate it competes with. A Texas buyer staring at $4.0/W and 15.88¢/kWh is not making the same bet as a New York buyer at $3.9/W and 29.90¢/kWh, even though the price per watt is almost identical.
Scope of the WGK™ reading
The rate input is a single month, July 2026, which captures summer pricing. EIA’s July figures are preliminary estimates based on a cutoff model sample. Production yield by state, net-metering compensation and fixed utility charges are outside the formula by design, so readers can apply their own. The reading will be recomputed when Berkeley Lab publishes 2026-install medians.
How Much Does a Solar Panel System Cost for a House?
For a house, the useful number is the system total, not the price per watt. Berkeley Lab puts the 2025 median residential system at 7.7 kW, up 0.5 kW from 2024, with most systems falling between roughly 5 and 12 kW.
| Purchase path | Median $/W (2025) | Estimated price, 7.7 kW | Source |
|---|---|---|---|
| Cash purchase, solar only | $3.0 | $23,100 | Berkeley Lab; Axis estimate |
| All host-owned, solar only | $3.6 | $27,720 | Berkeley Lab; Axis estimate |
| Loan-financed, solar only | $4.5 | $34,650 | Berkeley Lab; Axis estimate |
| Solar + battery, all host-owned | $4.9 (per W of PV) | $37,730 | Berkeley Lab; Axis estimate |
All prices before incentives, in 2025 dollars. Loan prices include origination fees passed through the installer but not ongoing interest.
Solar panel cost per watt by system size
Price per watt generally falls as systems get bigger, but the 2025 data are noisier than the textbook curve. Berkeley Lab notes that economies of scale are not especially visible among 2025 residential systems, even though earlier econometric work found clear effects.
| System size (kW) | Median $/W, 2025 installs | Source |
|---|---|---|
| ≤2 | $4.5 | Berkeley Lab |
| 2–3 | $4.2 | Berkeley Lab |
| 3–4 | $3.5 | Berkeley Lab |
| 4–5 | $3.4 | Berkeley Lab |
| 5–6 | $4.0 | Berkeley Lab |
| 6–7 | $4.0 | Berkeley Lab |
| 7–8 | $4.1 | Berkeley Lab |
| 8–9 | $3.8 | Berkeley Lab |
| 9–10 | $3.7 | Berkeley Lab |
| 10–11 | $3.6 | Berkeley Lab |
| 11–12 | $3.5 | Berkeley Lab |
| >12 | $3.2 | Berkeley Lab |
The very smallest systems are the most expensive per watt, at $4.5/W, because fixed costs like permitting, design and a truck roll get spread over fewer watts. Systems above 12 kW land at $3.2/W.
What Moves the Price of Installing Solar Panels?
Financing: the $1.5/W gap between cash and a loan
The biggest single variable on the 2025 data isn’t the state or the panel. It’s how the system is paid for. Berkeley Lab’s cash-purchase median was $3.0/W against $4.5/W for loan-financed systems. The lab attributes part of the difference to loan origination fees, often called dealer fees, that installers roll into the up-front price.
Axis Intelligence Research calculates that the $1.5/W gap equals about $11,550 on a 7.7 kW system — before a single interest payment. A homeowner comparing a “$0 down” loan offer with a cash price should ask for both numbers on the same contract.
The installer you hire: $2.4/W to $6.3/W
Berkeley Lab ranked the top 100 residential installers by their 2025 median price. Medians ran from $2.4/W to $6.3/W, excluding outliers. About 60% of those installers had medians below $4/W, almost a quarter were below $3/W, and about 10% were above $5/W. That installer spread, $3.9/W from cheapest to most expensive, is more than three times the $1.1/W gap between the cheapest and most expensive states.
Analyst commentary — Aidan Jad: If you take one thing from this page, take this. Where you live moves the price by about a dollar a watt. Who you sign with can move it by nearly four. Get three bids, compare them in dollars per watt DC, and ask each installer whether the price includes financing fees.
Adding a battery: +$2.1/W
Storage is now a mainstream add-on. Berkeley Lab found 37% of residential systems installed in 2025 were paired with a battery, up from 25% in 2024, with California driving much of the increase and Arizona and Texas showing large upticks. The median battery capacity was 13.5 kWh.
Among cash-purchase systems, solar-plus-storage cost a median $2.1/W more than solar alone, measured per watt of PV. On a 7.7 kW system, that premium works out to about $16,170, by Axis Intelligence Research’s calculation.
Soft costs: about 80% of what you pay
Over two decades, Berkeley Lab says residential installed prices have fallen $9–11/W, a 70–80% real decline, mostly through 2014 as module costs collapsed. Since then, declines have slowed to $0.1–0.2/W per year on average. With hardware cheap, soft costs and other balance-of-system costs now make up roughly 80% of the installed price.
Permitting time
Permitting is a smaller lever than it used to be. In 2025, Berkeley Lab found the apply-to-issue timeline for solar-only residential permits reached 25 days at the 80th percentile, and 21 days for solar-plus-storage. Zero-day permits remain common.
Does the Federal Solar Tax Credit Still Apply in 2026?
No, not for homeowners who buy their own system. The IRS confirms the Residential Clean Energy Credit under section 25D ended for expenditures made after December 31, 2025. The IRS FAQ on the One, Big, Beautiful Bill states that an expenditure is treated as made when the original installation is completed. A system paid for in 2025 but finished in 2026 doesn’t qualify.
That matters for every figure above. Berkeley Lab’s prices are gross, before incentives, so they are the right baseline for a 2026 buyer. But a 2025 buyer could subtract 30% from a gross price at tax time, and a 2026 buyer of an owned system cannot. State rebates, utility incentives and local property-tax exemptions still apply where they exist, and they vary by program.
The IRS FAQ does not address leased or third-party-owned systems, so this page makes no claim about them.
How to Read a Solar Quote Against These Numbers
- Convert every quote to dollars per watt DC. Divide the gross price, before incentives, by the system size in watts. A $26,000 quote for 8 kW is $3.25/W.
- Compare it to your state’s median. If your state is in the table, that median is what neighbors actually paid in 2025. A quote well above it should come with a reason, such as a battery, a main-panel upgrade or a difficult roof.
- Ask for the cash price on any loan offer. The national gap was $1.5/W in 2025, and part of it is financing fees built into the price.
- Price the battery separately. At a $2.1/W median premium, storage is a decision of its own, not a line item to accept by default.
- Check your WGK™. If you live in a low-WGK™ state, each watt displaces expensive power. If you live in a high-WGK™ state, the price per watt has to be sharper to make the same economic case.
Frequently Asked Questions
What is a fair price per watt to install solar panels in 2026?
The best benchmark is what homeowners actually paid. Berkeley Lab’s 2025 median for owned residential systems was $3.6/W, or $3.0/W for cash purchases. Quotes near or below your state median are in line with the market; quotes above $5/W sit in the costliest 10% of top installers.
Why is installing solar panels more expensive with a loan than with cash?
Loan-financed systems had a 2025 median of $4.5/W, against $3.0/W for cash, per Berkeley Lab. The lab cites loan origination fees passed into the up-front price as one likely cause. Those fees are separate from the interest you pay over the life of the loan.
Which state has the cheapest solar installation per watt?
Among the 16 states with enough 2025 data, Washington had the lowest median at $3.0/W, followed by Arizona and Florida at $3.1/W (Berkeley Lab). Cheapest installed price is not the same as best value: Washington ranks tenth on the Axis WGK™ because its grid power is also cheap.
In which state does rooftop solar replace the most expensive grid power?
California, on the Axis Intelligence Research WGK™. One installed watt at California’s $3.3/W median costs as much as 9.8 kWh of grid power at the state’s July 2026 residential rate of 33.61¢/kWh. Massachusetts follows at 11.2.
How much does adding a home battery add to the cost of solar?
Berkeley Lab’s 2025 data show a $2.1/W median premium for solar-plus-storage among cash buyers, measured per watt of PV. The median battery was 13.5 kWh. On a 7.7 kW system, Axis Intelligence Research estimates that premium at about $16,170.
Can I still claim the 30% solar tax credit if I install in 2026?
Not on a system you own. The IRS says the section 25D credit ends for expenditures made after December 31, 2025, and that an expenditure counts as made when installation is completed. A system completed in 2026 does not qualify, even if it was paid for earlier.
Why do two installers in the same state quote such different prices?
Installer pricing varies more than state pricing. Berkeley Lab found 2025 medians among the top 100 installers ranging from $2.4/W to $6.3/W. Business model, financing, vendor relationships and how each firm reports prices all play a part, and even a single installer’s projects typically span $1–2/W.
Are solar installation prices still falling?
Yes, slowly. Berkeley Lab measured a $0.5/W real decline in the median for owned residential systems from 2024 to 2025, larger for cash purchases. The longer-run pace since 2014 has been about $0.1–0.2/W per year, driven by soft costs rather than panels.
Methodology
Axis Intelligence Research assembled this page from two primary U.S. government datasets, fetched and read on October 1, 2026.
Installed prices. All price-per-watt figures come from Berkeley Lab’s U.S. Distributed Solar and Storage data, the 2026 data update (August 2026), the successor to the Tracking the Sun report series. The update covers roughly 450,000 systems installed in 2025, about 93% of the U.S. market. Prices are the up-front price reported by installers or customers, before incentives, in real 2025 dollars per watt DC. They include loan dealer fees where passed through. Berkeley Lab excludes third-party-owned systems and self-installs from price statistics and drops prices outside $1–20/W as likely data entry errors. State medians are reported only where at least 20 observations exist. Values were read from the published summary charts at one-decimal precision, as labeled by Berkeley Lab. Additional state and installer series are available through Berkeley Lab’s data viewer.
Electricity prices. State residential rates come from EIA Electric Power Monthly Table 5.6.A, July 2026 and July 2025 columns, released September 2026. EIA labels these values preliminary.
Axis calculations.
- Estimated system price = median $/W × 7,700 W (Berkeley Lab’s 2025 national median residential size). Labeled as estimates throughout.
- WGK™ = median installed price ($/W) ÷ residential electricity price ($/kWh, July 2026).
- Loan-cash gap = ($4.5 − $3.0) × 7,700 = $11,550. State spread = ($4.1 − $3.0) × 7,700 = $8,470. Battery premium = $2.1 × 7,700 = $16,170.
All arithmetic was run twice in Python, once in floating point and once with exact rational fractions, before entering the text.
Scope. Prices describe 2025 installations, the latest full year Berkeley Lab has published; 2026 installs have no comparable dataset yet. Price data come mostly from states with incentive or interconnection programs that record prices, and California makes up about half the residential sample.
About This Dataset
The full dataset behind this page — state medians, size-band medians, financing splits, storage figures, EIA rates and every WGK™ reading — is available as install-solar-panels-cost.csv, with one row per observation and source columns on every row. Licensed under CC BY 4.0.
Cite This Page
APA: Axis Intelligence Research, & Jad, A. (2026, October 1). How much does it cost to install solar panels in 2026? Price per watt by state, from 450,000 real installs. Axis Intelligence. https://axis-intelligence.com/install-solar-panels-cost/
MLA: Axis Intelligence Research, and Aidan Jad. “How Much Does It Cost to Install Solar Panels in 2026? Price per Watt by State, From 450,000 Real Installs.” Axis Intelligence, 1 Oct. 2026, axis-intelligence.com/install-solar-panels-cost/.
Chicago: Axis Intelligence Research, and Aidan Jad. “How Much Does It Cost to Install Solar Panels in 2026? Price per Watt by State, From 450,000 Real Installs.” Axis Intelligence, October 1, 2026. https://axis-intelligence.com/install-solar-panels-cost/.
Related Axis Intelligence Research
- Global capacity and module cost trends: solar energy statistics
- What drives the retail rates in the WGK™: US electricity statistics
- Batteries, smart thermostats and the home as a grid asset: home energy automation statistics
- Meters, demand response and virtual power plants: smart grid statistics
- The wider transition: renewable energy statistics