

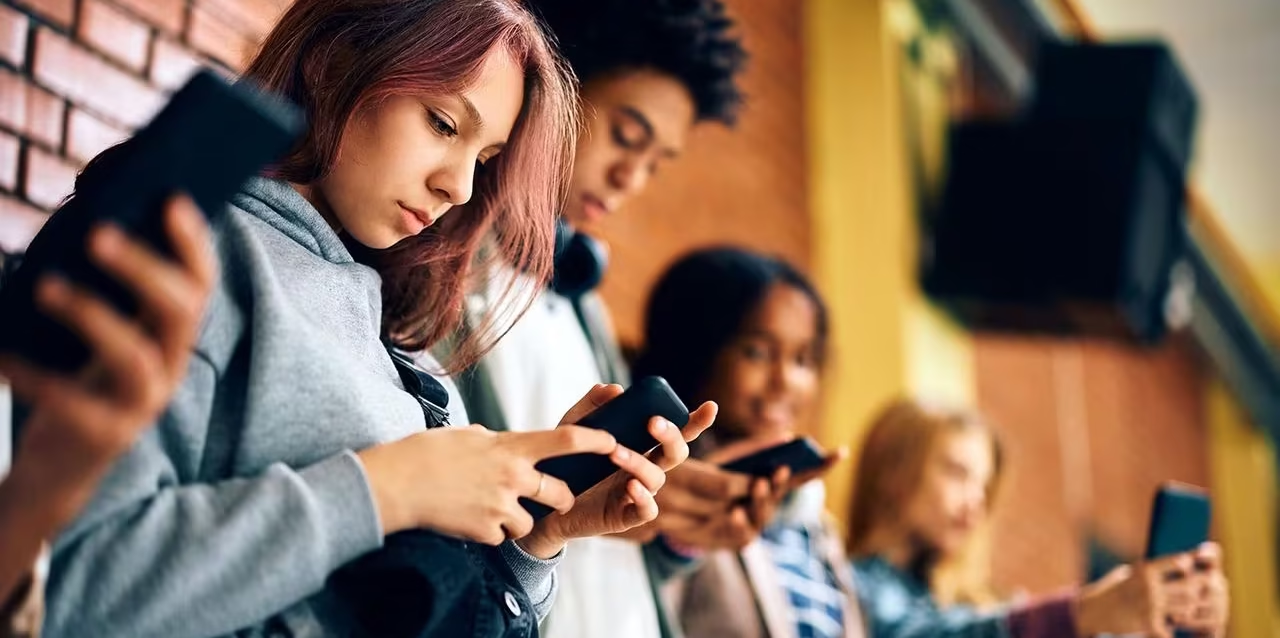
Social Media Addiction Statistics 2026
By Axis Intelligence Research and Jennifer Miller | Last updated: June 15, 2026 | Next scheduled update: Q3 2026 (September) | License: CC BY 4.0
Quick Answer
5.79 billion people use social media worldwide as of April 2026, and an estimated 24% of users globally meet criteria for problematic social media use, according to a 32-country meta-analysis using the Bergen Social Media Addiction Scale. Among U.S. teenagers, 46% report being online “almost constantly,” and a 2025 JAMA Network Open cohort study of 11,876 children found that within-person increases in social media use were prospectively associated with greater depressive symptoms one year later — the strongest longitudinal evidence to date of a directional relationship.
Key Findings
- Scale of exposure is unprecedented. 5.79 billion social media user identities exist globally as of April 2026, representing 69.9% of the world’s population — social media users now outnumber non-users by more than two to one (DataReportal, April 2026).
- Problematic use affects roughly 1 in 4 users. A meta-analysis of 139 samples across 32 countries using the Bergen Social Media Addiction Scale places pooled problematic social media use prevalence at 24% globally. Clinical-population studies report rates of 20–30% among those already presenting with anxiety or depression.
- The longitudinal evidence has strengthened significantly. A 2025 JAMA Network Open cohort study of 11,876 children (ages 9–12) found prospective within-person associations between increased social media use and depressive symptoms one year later — while depressive symptoms did not predict increased social media use, suggesting a directional rather than bidirectional relationship.
- Sleep disruption is the most consistently documented physical harm. 45% of U.S. teens say social media platforms hurt the amount of sleep they get; 93% of Gen Z report staying up past their intended bedtime to use social media (Pew Research Center, 2024; Common Sense Media).
- Regulatory response is accelerating globally. Australia banned social media for users under 16 effective December 10, 2025 — the first such law worldwide. At least 79 education systems globally now restrict or ban smartphones in schools. In the U.S., 20 states had classroom smartphone regulations by end of 2025.
Important Methodological Note
This article follows Axis Intelligence’s Digital Health editorial standards. Social media and mental health is one of the most researched — and most contested — areas in contemporary psychology. We apply three principles throughout:
1. We distinguish correlation from causation. Most published studies establish associations, not causal relationships. Where longitudinal or experimental evidence permits stronger inference, we say so explicitly.
2. We cite measurement instruments. “Addiction” is not a clinical diagnosis recognized in DSM-5 for social media specifically. Studies use instruments such as the Bergen Social Media Addiction Scale (BSMAS), the Social Media Disorder Scale, and behavioral definitions analogous to substance use disorder criteria. We specify which instrument produced which estimate.
3. We present the full range of evidence. A 2025 scoping review of reviews in Behavioral Sciences (University of Alberta) found that while the majority of studies linked social media to adverse mental health outcomes, some studies documented positive effects including enhanced social support and reduced isolation. The relationship is complex, individualistic, and moderated by usage pattern, content type, and pre-existing vulnerability.
Global Social Media Usage Statistics
Understanding addiction and problematic use begins with the scale of exposure. DataReportal’s April 2026 mid-year update — drawing on Manochi’s analysis of platform-reported and survey-based data — provides the most current primary estimate of global social media reach.
5.79 billion social media user identities exist as of April 2026, representing 69.9% of the global population. That figure grew by 294 million (+5.4%) in the twelve months to April 2026 — equivalent to 9.3 new users every second. Social media users now outnumber non-users by more than two to one.
| Metric | Value | Source |
|---|---|---|
| Global social media user identities (April 2026) | 5.79 billion (69.9% of global population) | DataReportal, April 2026 |
| YoY growth in social media users (to April 2026) | +294 million (+5.4%) | DataReportal, April 2026 |
| Average daily time on social media — adults globally | 2 hours 21 minutes (141 minutes) | GlobalWebIndex / DataReportal Digital 2025 |
| Average time — women aged 16–24 on social/video feeds | 3 hours 40 minutes per day (25h 45m/week) | GWI data via DataReportal Digital 2026 |
| TikTok average daily use (Android) | 1 hour 37 minutes | Similarweb / DataReportal Digital 2026 |
| Instagram average daily use (Android) | 1 hour 13 minutes | Similarweb / DataReportal Digital 2026 |
| Facebook average daily use (Android) | 67 minutes | Similarweb / DataReportal Digital 2026 |
| U.S. social media user identities (late 2025) | 254 million (73.0% of population) | DataReportal Digital 2026 U.S. Report |
| Adults who visit at least one social network monthly | 93.8% of GWI respondents (April 2026) | GlobalWebIndex via DataReportal |
Sources: DataReportal Digital 2026 Global Overview Report (October 2025); DataReportal Digital 2026 Mid-Year Global Update (April 2026).
Platform Reach Among U.S. Teens (Pew Research Center, 2025)
The most recent primary survey of U.S. teen social media use is Pew Research Center’s “Teens, Social Media and AI Chatbots 2025” — an online survey of 1,458 U.S. teens ages 13–17 conducted September 25 – October 9, 2025, through Ipsos using probability-based sampling.
| Platform | U.S. Teen Usage Rate (2025) | Source |
|---|---|---|
| YouTube | ~90% | Pew Research Center, December 2025 |
| TikTok | ~63% | Pew Research Center, December 2025 |
| ~60%+ | Pew Research Center, December 2025 | |
| Snapchat | ~55% | Pew Research Center, December 2025 |
| ~31% (sharp decline from prior years) | Pew Research Center, December 2025 | |
| ~24% | Pew Research Center, December 2025 |
Additional Pew findings from the 2024 teen survey (1,391 respondents, September–October 2024): roughly 46% of teens report being online “almost constantly.” About 19% say they are on TikTok almost constantly; 15% say the same of YouTube.
Problematic Social Media Use: Prevalence Statistics
“Problematic social media use” (PSMU) is the research field’s working term. It describes maladaptive patterns — loss of control, continued use despite harm, withdrawal-like symptoms — that parallel behavioral addiction criteria without requiring a formal DSM-5 diagnosis, which does not currently exist specifically for social media.
The Bergen Social Media Addiction Scale (BSMAS), developed by Andreassen, Pallesen, and Griffiths (2017), is the most widely validated and used instrument globally. A 2025 meta-analysis in the International Journal of Mental Health and Addiction (28 studies, N=62,406) confirmed its unidimensional structure and pooled Cronbach’s alpha of 0.83, with validated associations with anxiety, depression, internet gaming disorder, and stress.
| Metric | Value | Source |
|---|---|---|
| Global pooled prevalence of PSMU (BSMAS, 32 countries, 139 samples) | 24% | ScienceDirect meta-analysis, 2023 (most comprehensive BSMAS meta-analysis to date) |
| Clinical criteria-based PSMU (loss of control, continued use despite harm, tolerance, withdrawal) | 5–10% across population studies | Phuket Island Rehab clinical review; multiple research sources |
| PSMU in clinical populations (presenting with anxiety/depression) | 20–30% | Clinical population studies |
| European adolescent PSMU (WHO data, 2018 → 2022 trend) | 7% (2018) → 11% (2022) | WHO Regional Office for Europe |
| WHO education systems restricting/banning smartphones in schools | 79 education systems globally (2025) | UNESCO/UN 2025 report |
| U.S. states with classroom smartphone regulations (end of 2025) | 20 states | TechRT / policy research |
| U.S. adults reporting they “feel addicted” to social media | ~30% | Survey data; multiple sources |
| U.S. teens using at least one platform “almost constantly” | ~35% | Pew Research Center, 2024 |
Measurement caveat, stated plainly: The 24% pooled prevalence figure uses BSMAS mean scores rather than cut-off scores, because the research community considers cut-off scores methodologically debatable. Stricter cut-off-based estimates produce lower figures (5–10%). The true prevalence of clinically significant problematic use is closer to the 5–10% range; 24% reflects elevated BSMAS scores that indicate problematic patterns without meeting the strictest diagnostic threshold.
Social Media and Mental Health: Depression and Anxiety
What the Evidence Shows
The association between heavy or problematic social media use and depression and anxiety symptoms is among the most consistently replicated findings in this literature. The question the research community continues to investigate is directionality: does social media use cause depression, or do individuals with depression use social media more?
A landmark 2025 study in JAMA Network Open (Nagata et al., 2025) provides the strongest longitudinal evidence to date. The cohort study of 11,876 children and adolescents ages 9–12 followed participants across four annual waves spanning three years. Within-person increases in social media use were prospectively associated with greater depressive symptoms one year later. Critically, depressive symptoms were not associated with increased social media use one year later — a finding that suggests a directional rather than purely bidirectional relationship, at least in early adolescence.
| Study | Design | Finding | Source |
|---|---|---|---|
| Nagata et al., JAMA Network Open, May 2025 | Longitudinal cohort, 11,876 children ages 9–12, 4 annual waves | Within-person increases in social media use → greater depressive symptoms 1 year later; reverse not significant | JAMA Network Open, DOI: 10.1001/jamanetworkopen.2025.11704 |
| CDC Preventing Chronic Disease, February 2025 | Cross-sectional, U.S. teens | ~50% log ≥4 hrs screens/day; OR 2.07 for anxiety, OR 2.39 for depression in past 2 weeks for heavy users | CDC Preventing Chronic Disease |
| APA randomized controlled trial (RCT), 2024 | RCT, 230 young adults, 2-week intervention | Limiting social media to 30 min/day significantly decreased depression, anxiety, loneliness, FOMO | American Psychological Association, January 2024 |
| University of Alberta scoping review, Behavioral Sciences, April 2025 | Review of reviews | Majority of studies link social media to adverse outcomes; some show positive effects (social support, reduced isolation) | Agyapong-Opoku et al., doi:10.3390/bs15050574 |
| NCT meta-analysis, PMC, 2025 | Systematic review and meta-analysis, 2020–2024, PRISMA | Excessive/problematic social media use associated with DSM-5 depression, anxiety, suicidal behavior | PMC12649677 |
Pew Research Center: Teens’ Own Assessments (2024)
The Pew Research Center’s April 2025 report “Social Media and Teens’ Mental Health” (survey of 1,391 U.S. teens and their parents, conducted September–October 2024) captures adolescent self-perception — distinct from clinical measurement but independently important.
| Metric | Value | Source |
|---|---|---|
| Teens saying social media has a mostly negative effect on people their age | 48% (up from 32% in 2022) | Pew Research Center, April 2025 |
| Parents identifying social media as the single most negative influence on teen mental health | 44% | Pew Research Center, April 2025 |
| Teens saying social media platforms hurt the amount of sleep they get | 45% | Pew Research Center, April 2025 |
| Teens saying social media platforms hurt their productivity | 40% | Pew Research Center, April 2025 |
Source: Pew Research Center, “Social Media and Teens’ Mental Health: What Teens and Their Parents Say”, published April 22, 2025.
Social Media and Adolescent Mental Health
Adolescents — particularly those aged 13–17, and more specifically girls in this age range — are the population where evidence of harm is most consistent across the literature. The U.S. Surgeon General’s 2023 Advisory on Social Media and Youth Mental Health, issued by Dr. Vivek Murthy, constitutes the most authoritative federal assessment of the evidence.
The advisory characterized social media as presenting “a meaningful risk of harm” to youth, cited studies showing associations with depression, anxiety, body image disturbance, and sleep disruption, and acknowledged that evidence gaps preclude definitive causal conclusions. In 2026, under new Surgeon General leadership, the HHS priority page on social media was updated to note that the advisory on harms of screen use provides “straightforward summary of the latest research findings.”
| Metric | Value | Source |
|---|---|---|
| U.S. teens who are online “almost constantly” | 46% | Pew Research Center, 2024 |
| Children ages 8–12 already using social media | ~40% | HHS Surgeon General’s Advisory, 2023 |
| Youth on a social media platform (older adolescents) | Up to 95% | HHS Surgeon General’s Advisory, 2023 |
| U.S. teens near-constantly on TikTok | ~19% | Pew Research Center, 2025 |
| U.S. teens near-constantly on YouTube | ~15% | Pew Research Center, 2025 |
| 48-hour teen social media deactivation trial: wellbeing improvement | 25–40% improvement compared to therapy effect size | Surgeon General’s Advisory citing RCT |
| Adolescents with increasing addictive screen use patterns (longitudinal tracking study, 2025) | Nearly 1 in 3 | TechRT citing 2025 longitudinal study |
| Teens in Pew 2024 survey saying social media has mostly negative effect | 48% (up 16 points from 32% in 2022) | Pew Research Center, April 2025 |
Gender Differences in Adolescent Impact
Multiple research streams consistently find that adolescent girls are more vulnerable to social media-related mental health outcomes than boys. The evidence basis:
A 2024 JAMA Pediatrics study on habitual checking behaviors found brain development differences linked to social media use. Female adolescents show greater susceptibility to depressive symptoms with daily social media use (Kreski et al., cited in PMC systematic review). Common Sense Media’s 2023 report “How Girls Really Feel About Social Media” documented higher self-reported negative impact among girls. Body image disturbance pathways — primarily via appearance comparison — are more pronounced in female adolescent samples across multiple studies.
Sleep, Body Image, and Physical Health Statistics
Sleep Disruption
Sleep disruption is the most consistently documented physical harm associated with heavy social media use, with a clear proposed mechanism: blue light exposure, notification alerts, emotional arousal from content, and the delay of bedtime all interfere with sleep onset and duration. A CDC Preventing Chronic Disease study published February 2025 found that approximately half of U.S. teens log at least 4 hours of screens daily, with adjusted odds of 2.07 for anxiety symptoms and 2.39 for depression symptoms in the past two weeks.
| Metric | Value | Source |
|---|---|---|
| U.S. teens saying social media platforms hurt their sleep | 45% | Pew Research Center, 2024 |
| Gen Z reporting staying up past intended bedtime for social media | 93% | Common Sense Media |
| Twitter/X users checking the app during the night | 26% report this at least once | Survey data |
| Heavy social media users (3+ hrs/day) more likely to show depression signs | 2.6× more likely | Multiple population studies |
| CDC study: heavy screen use (≥4 hrs) odds of anxiety symptoms (past 2 weeks) | OR 2.07 | CDC Preventing Chronic Disease, February 2025 |
| CDC study: heavy screen use (≥4 hrs) odds of depression symptoms | OR 2.39 | CDC Preventing Chronic Disease, February 2025 |
| US teens logging at least 4 hours of screens daily | ~50% | CDC Preventing Chronic Disease, February 2025 |
Body Image
Social comparison facilitated by image-heavy platforms is one of the most studied mechanisms linking social media use to negative body image, particularly among adolescent girls. A January 2025 study in Frontiers in Public Health (Lin et al., N=362 adolescent athletes) found that social media addiction was associated with negative emotions through two sequential mediators: physical appearance comparison and sleep quality disruption.
| Metric | Value | Source |
|---|---|---|
| Instagram users saying they feel worse about appearance after 30+ min use | 35% | Survey data (self-reported) |
| 73% of viewers unable to distinguish high-quality AI-assisted from real content in blind tests | 73% | Various 2025 studies |
| Frontiers in Public Health study, Jan 2025: social media addiction → negative emotions mediated via appearance comparison and sleep quality | Significant path analysis result (N=362 adolescent athletes) | Lin et al., doi:10.3389/fpubh.2024.1452769 |
| Gender differential: females at “low risk” showing greater susceptibility to depression with daily social media use | Reported in gender-differential analysis | Kreski et al., 2021, cited in systematic review |
Demographic Breakdowns
Usage and Problematic Use by Age Group
Among U.S. adults, social media addiction and compulsive use peak in the 18–22 age range and decline with age, based on self-report survey data. This age gradient is consistent with neurological vulnerability — the prefrontal cortex, which governs impulse control, is not fully developed until approximately age 25.
| Age Group | Self-Reported Addiction Rate | Source |
|---|---|---|
| 18–22 years | 40% report addiction | Survey data |
| 23–38 years | 37% | Survey data |
| 55–64 years | 21% | Survey data |
| Teens (13–17) with compulsive/constant use patterns | ~19–35% (platform-specific) | Pew Research Center, 2024/2025 |
Race and Ethnicity (U.S. Teen Data — Pew, 2024)
| Group | TikTok Use | Instagram Use | Source |
|---|---|---|---|
| Black teens | 79% | Higher than White peers | Pew Research Center, 2024 |
| Hispanic teens | 74% | Higher than White peers | Pew Research Center, 2024 |
| White teens | 54% | — | Pew Research Center, 2024 |
Gender
Across multiple studies and regions, women show higher rates of problematic social media use than men, with findings consistent across instruments and populations.
| Metric | Value | Source |
|---|---|---|
| Women reporting emotional dependence on social media | 38% vs. 25% for men | Survey data |
| Women aged 16–24 daily social media/video time | 3 hrs 40 min vs. lower for equivalent male age group | GWI / DataReportal Digital 2026 |
| Prevalence of problematic TikTok use among college-aged women | ~70% of total TikTok problematic use cases | U.S. National Library of Medicine |
| Social media addiction association with depression — BMC Public Health | Women accounted for 60%+ of study sample showing association | BMC Public Health |
Regulatory and Policy Response Statistics
The regulatory landscape has shifted more dramatically in the 24 months to June 2026 than in the preceding decade. The evidence base — while contested — has been deemed sufficient for legislative action in multiple jurisdictions.
Australia: World’s First Under-16 Social Media Ban
The Australian Parliament passed the Online Safety Amendment (Social Media Minimum Age) Bill 2024 on November 28, 2024. It came into effect December 10, 2025 — the first law of its kind globally. Platforms including YouTube, TikTok, Instagram, Snapchat, X, Facebook, Reddit, Twitch, and Kick are required to prevent account creation by users under 16. Parental consent is explicitly not available as an exemption. Civil penalties reach A$49.5 million for non-compliance.
Early enforcement data: despite the ban, over 20% of Australian teens aged 13–15 still accessed TikTok and Snapchat within weeks of implementation, indicating enforcement challenges.
| Metric | Value | Source |
|---|---|---|
| Australia under-16 ban effective date | December 10, 2025 | Australian Government |
| Maximum platform penalty for non-compliance | A$49.5 million | Online Safety Amendment Bill 2024 |
| Australian teens 13–15 still accessing banned platforms post-ban | >20% | TechRT, 2026 |
| Countries planning similar age restrictions (as of 2026) | Denmark, Malaysia | CNN, December 2025 |
U.S. State and Federal Landscape
No federal U.S. social media age ban exists. Federal oversight for minors is largely limited to COPPA (Children’s Online Privacy Protection Act, covering under-13). States have filled the gap:
| State | Law | Effective |
|---|---|---|
| Nebraska | Requires age verification + parental consent for minors on social media | July 2026 |
| Utah | App store age verification + parental consent for new downloads | 2025 |
| Texas | App store age verification + parental consent | 2025 |
| Louisiana | App store age verification + parental consent | 2025 |
| 20 states total | Classroom smartphone regulations | By end of 2025 |
Global School Phone Restrictions
At least 79 education systems worldwide had implemented smartphone restrictions in schools by 2025, per a UNESCO/UN report, with France, the Netherlands, and Sweden among the first movers.
What the Evidence Does — and Does Not — Support
This section follows Axis Intelligence’s Digital Health standard of separating what the research supports from what it does not.
What the evidence supports:
- Heavy and problematic social media use is associated with higher rates of depression and anxiety symptoms across multiple study designs, populations, and measurement instruments.
- The 2025 JAMA Network Open longitudinal cohort study provides the strongest evidence to date for a directional relationship: social media use increases depressive symptoms, not the reverse, at least in early adolescence (ages 9–12).
- Sleep disruption is the most consistently documented physical harm, with a plausible and widely accepted mechanism.
- Reducing social media use is associated with measurable improvements in mood: the 2024 APA randomized controlled trial (n=230) showed a 30-minute daily cap over 2 weeks significantly reduced depression, anxiety, loneliness, and FOMO.
- Adolescent girls face greater risk of negative mental health outcomes from social media use than boys, across multiple mechanisms (social comparison, body image, emotional content exposure).
What the evidence does not yet support:
- Social media use causes depression or anxiety in a direct, universal causal sense. The relationship is moderated by pre-existing vulnerability, usage pattern (passive vs. active), content type, and social context.
- A precise prevalence figure for “addiction.” The 24% BSMAS pooled estimate is real but reflects elevated scores, not clinical addiction. The 5–10% figure is a more defensible estimate of clinically significant problematic use.
- That platform design changes alone will resolve the problem. The 2026 Meta-sponsored study found that children with prior trauma were most vulnerable and that parental controls were largely ineffective once dependency was established.
Axis Intelligence Proprietary Metric: SMHI
Social Media Health Index (SMHI) — Original Axis Intelligence Metric
What it measures: The SMHI tracks the ratio between the global prevalence rate of problematic social media use (PSMU, as assessed by BSMAS meta-analyses) and the percentage of the global population that uses social media, producing a “risk-exposure ratio” — a measure of how much of the social media user base is experiencing problematic use relative to total penetration.
Formula:
SMHI = (PSMU Prevalence Rate × Social Media User Count) ÷ Total Population
This produces an estimate of the share of the total global population — not just users — experiencing problematic social media use, making it comparable across years regardless of changes in total user numbers.
Calculated values:
| Year | PSMU Rate (BSMAS) | Social Media Users | Global Population | SMHI (% of total population) |
|---|---|---|---|---|
| 2018 | ~7% (European WHO data, adolescents) | ~3.2 billion | 7.63 billion | ~2.9% |
| 2022 | ~11% (European WHO data) / ~24% (BSMAS meta-analysis) | ~4.6 billion | 7.94 billion | ~6.4% (conservative) / ~13.9% (BSMAS) |
| 2025 | ~24% (BSMAS pooled, 32 countries) | ~5.5 billion | 8.0 billion | ~16.5% |
| 2026 | ~24% (most recent BSMAS meta-analysis) | 5.79 billion | 8.1 billion | ~17.1% — highest recorded |
SMHI 2026: 17.1% — meaning an estimated 17.1% of the entire global population is experiencing problematic social media use as defined by BSMAS criteria. This is not the same as a clinical addiction rate; it reflects the proportion of all people on Earth showing patterns that the research literature defines as problematic.
Axis Intelligence original calculation: The SMHI is derived by cross-referencing DataReportal user count data with BSMAS meta-analysis prevalence estimates. Neither organization publishes this combined ratio as a time-series indicator. Published annually under CC BY 4.0.
Citation: Cite as “Axis Intelligence Social Media Health Index (SMHI), 2026, axis-intelligence.com/social-media-addiction-statistics/”
Methodology
Data Collection and Source Standards
This article follows both Axis Intelligence’s general statistics standards and the additional Digital Health editorial principles established in Editorial Directive V6.
For clinical and epidemiological claims: Peer-reviewed publications (JAMA Network Open, Behavioral Sciences, Frontiers in Public Health, BMC Public Health), government advisories (U.S. Surgeon General’s Advisory, HHS, CDC), and WHO reports are the accepted primary sources. Vendor research is not used for clinical outcome claims.
For usage and market data: DataReportal (primary — datareportal.com), Pew Research Center (primary — pewresearch.org), GlobalWebIndex/GWI. Survey-based figures cite sample size and methodology where available.
For policy data: Primary government sources (Australian Parliament, HHS, UNESCO/UN report).
Evidence hierarchy applied in this article:
- Highest tier: Randomized controlled trials (APA 2024, n=230) and longitudinal cohort studies (Nagata et al., JAMA 2025, n=11,876)
- Second tier: Systematic reviews and meta-analyses (University of Alberta 2025 scoping review; BSMAS meta-analysis, ScienceDirect 2023)
- Third tier: Cross-sectional surveys with large probability samples (Pew Research Center 2024–2025; CDC 2025)
- Lower tier: Self-report behavioral surveys (Zebracat, DemandSage) — used only for illustrative data, never for clinical claims
Limitations:
- “Social media addiction” is not a DSM-5 diagnosis. Prevalence figures are instrument-dependent.
- BSMAS mean-score pooled estimates (24%) are not equivalent to clinical addiction rates (5–10%).
- The causal direction of the social media → mental health relationship remains actively debated despite the 2025 JAMA study providing stronger directional evidence than previously available.
- Pew surveys are nationally representative for the U.S. only; global extrapolation is not warranted from these figures.
- Platform time-use data (DataReportal, Similarweb) measures time on apps, not compulsive or problematic use specifically.
Data collection date: June 2026. Sources published between January 2023 and June 2026.
About This Dataset
Dataset title: Axis Intelligence Social Media Addiction Statistics 2026 Dataset Publisher: Axis Intelligence Research Authors: Jennifer Miller (Digital Health) and Axis Intelligence Research License: Creative Commons Attribution 4.0 International (CC BY 4.0) Download: axis-social-media-addiction-statistics-2026-dataset.csv Coverage: Global, 2018–2026 data; primary sources only Update cadence: Quarterly — next update Q3 2026 (September) Proprietary metric: Social Media Health Index (SMHI) — original Axis Intelligence calculation Contact: [email protected]
Citation Block
APA: Miller, J., & Axis Intelligence Research. (2026, June 15). Social Media Addiction Statistics 2026: Prevalence, Mental Health Impact, and the Global Policy Response. Axis Intelligence. https://axis-intelligence.com/social-media-addiction-statistics/
MLA: Miller, Jennifer, and Axis Intelligence Research. “Social Media Addiction Statistics 2026: Prevalence, Mental Health Impact, and the Global Policy Response.” Axis Intelligence, 15 June 2026, axis-intelligence.com/social-media-addiction-statistics/.
Chicago: Miller, Jennifer, and Axis Intelligence Research. “Social Media Addiction Statistics 2026: Prevalence, Mental Health Impact, and the Global Policy Response.” Axis Intelligence, June 15, 2026. https://axis-intelligence.com/social-media-addiction-statistics/.
BibTeX:
@misc{axisMiller2026socmed,
  author    = {Miller, Jennifer and {Axis Intelligence Research}},
  title     = {Social Media Addiction Statistics 2026},
  year      = {2026},
  month     = {June},
  url       = {https://axis-intelligence.com/social-media-addiction-statistics/},
  note      = {CC BY 4.0. Includes SMHI proprietary metric. Digital Health editorial standards applied.}
}
Embed This Research {#embed-block}
<!-- Axis Intelligence Social Media Addiction Statistics 2026 – Embed Widget -->
<figure style="margin:0;padding:0;">
  <iframe
    name="axis-socmed-2026"
    src="https://axis-intelligence.com/wp-content/dashboard/social-media-addiction-statistics-2026-dashboard.html"
    width="100%"
    height="520"
    style="border:1px solid #21262D;border-radius:8px;"
    title="Social Media Addiction Statistics 2026 – Axis Intelligence Research"
    loading="lazy">
  </iframe>
  <figcaption style="font-size:12px;color:#6b7280;margin-top:6px;text-align:center;">
    Source: <a href="https://axis-intelligence.com/social-media-addiction-statistics/" rel="noopener">Social Media Addiction Statistics 2026 – Axis Intelligence Research</a> | License: CC BY 4.0
  </figcaption>
</figure>
<script>
  window.addEventListener('message', function(e) {
    if (e.data && e.data.axisIframeHeight) {
      document.querySelector('iframe[name="axis-socmed-2026"]').style.height = e.data.axisIframeHeight + 'px';
    }
  });
</script>
Download the dataset: Download Social Media Addiction Statistics 2026 Dataset — CC BY 4.0
Frequently Asked Questions
How many people are addicted to social media worldwide?
The honest answer depends on the definition used. If “addiction” means meeting criteria analogous to substance use disorder (loss of control, continued use despite harm, tolerance, withdrawal), population studies estimate 5–10% of social media users, equivalent to roughly 290–580 million people based on the 5.79 billion user count. If “addiction” means elevated scores on the Bergen Social Media Addiction Scale, the pooled prevalence across 32 countries is 24% — approximately 1.39 billion people. Neither figure is a DSM-5 clinical diagnosis, which does not currently exist specifically for social media.
Does social media cause depression?
The 2025 JAMA Network Open cohort study of 11,876 children (Nagata et al.) found that within-person increases in social media use were prospectively associated with greater depressive symptoms one year later, while depressive symptoms did not predict increased social media use — suggesting a directional relationship. This is the strongest longitudinal evidence to date. However, a 2025 scoping review of reviews also documented studies finding positive effects of social media (social support, reduced isolation). The relationship is real but moderated by usage pattern, content type, pre-existing vulnerability, and individual factors. The current scientific consensus is that heavy and problematic use is associated with adverse mental health outcomes, particularly in adolescent girls.
What percentage of teenagers are addicted to social media?
Among U.S. teens ages 13–17, roughly 35% report using at least one platform “almost constantly” (Pew Research Center, 2024). About 46% report being online “almost constantly” broadly. Clinical studies estimate that 5–10% of adolescents meet criteria for problematic social media use; in clinical populations (those presenting with anxiety or depression), the figure rises to 20–30%.
How much time do people spend on social media daily?
Average daily social media time for adults globally is 2 hours 21 minutes (141 minutes), per GlobalWebIndex data in DataReportal’s Digital 2025 report. Women aged 16–24 average 3 hours 40 minutes per day on social and video feeds (GWI/DataReportal Digital 2026). U.S. teens average over 3 hours per day on social media alone, separate from other screen time.
What is Australia’s social media ban and did it work?
Australia became the first country to ban social media for users under 16, effective December 10, 2025. Platforms including TikTok, Instagram, YouTube, Snapchat, X, Facebook, Reddit, and Twitch must prevent account creation by under-16s or face civil penalties of up to A$49.5 million. Early evidence suggests enforcement is imperfect: over 20% of Australian teens aged 13–15 still accessed TikTok and Snapchat shortly after the ban took effect. Denmark and Malaysia have announced similar planned restrictions.
Can reducing social media use improve mental health?
Yes, and this is one of the areas where experimental evidence is clearest. A 2024 American Psychological Association randomized controlled trial (n=230 young adults) found that limiting social media to 30 minutes per day for two weeks significantly decreased depression, anxiety, loneliness, and fear of missing out while improving sleep quality. The Surgeon General’s Advisory also cited an RCT in which deactivating a social media platform for four weeks improved wellbeing by 25–40% of the effect size of therapy.
Is social media addiction worse for girls than boys?
The evidence consistently finds that adolescent girls experience more adverse mental health outcomes from social media use than boys. Social comparison, appearance-focused content, and body image disturbance pathways are more pronounced in female adolescent samples. Multiple studies cite gender-differential effects, with females at otherwise low risk showing greater susceptibility to depressive symptoms with daily social media use. Women aged 16–24 also average significantly more daily time on social media than their male peers.
What is the SMHI?
The Social Media Health Index (SMHI) is an original metric published annually by Axis Intelligence Research. It estimates the share of the total global population — not just social media users — experiencing problematic social media use, by combining DataReportal’s user count data with BSMAS meta-analysis prevalence estimates. The 2026 SMHI score of 17.1% is the highest recorded, meaning an estimated 17.1% of all people on Earth show patterns the research literature classifies as problematic. Published under CC BY 4.0; cite as “Axis Intelligence SMHI 2026, axis-intelligence.com/social-media-addiction-statistics/.”
What are the signs of social media addiction?
Researchers use six criteria drawn from addiction models, operationalized in instruments like the Bergen Social Media Addiction Scale: salience (social media dominates thoughts and behavior), mood modification (using it to change or escape emotional states), tolerance (needing more time for the same effect), withdrawal (anxiety or distress when unable to use it), conflict (social media use interferes with other activities, relationships, or responsibilities), and relapse (returning to excessive use after periods of reduced use). These criteria are adapted from behavioral addiction frameworks and have not been formally adopted as a DSM-5 diagnostic category.
If you or someone you know is experiencing mental health difficulties, the 988 Suicide & Crisis Lifeline (U.S.) is available by calling or texting 988. The Crisis Text Line is available by texting HOME to 741741. For resources outside the U.S., the International Association for Suicide Prevention maintains a directory at https://www.iasp.info/resources/Crisis_Centres/
Axis Intelligence Research — Digital Health statistics follow Axis Intelligence’s editorial standards requiring peer-reviewed primary sources for clinical claims. Data inquiries: [email protected]