

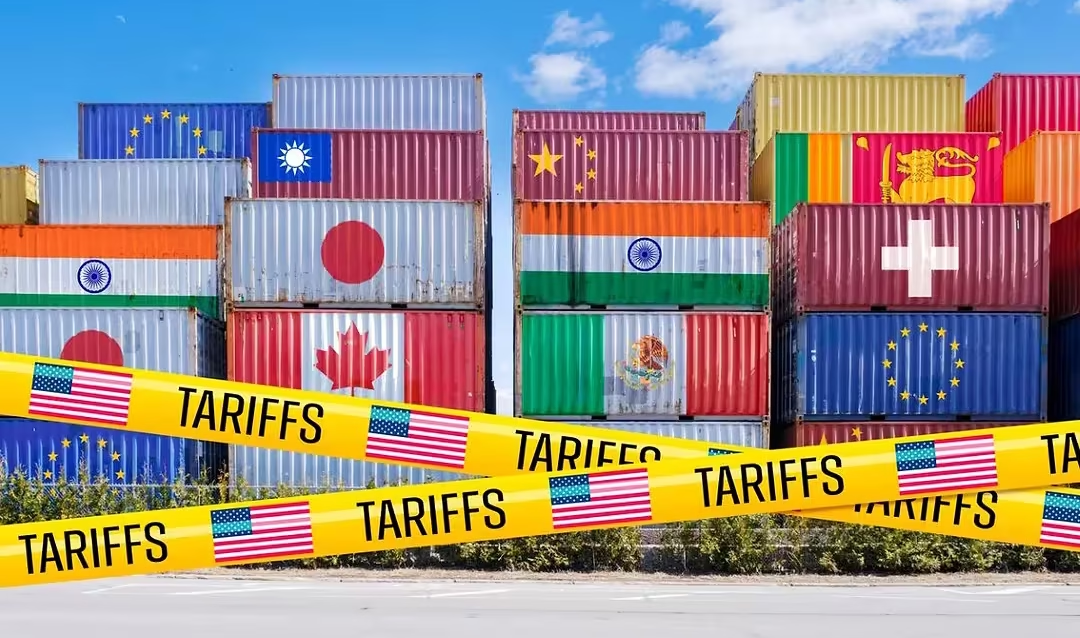
U.S. Tariff Rates by Country 2026
By Axis Intelligence Research
Co-author: Mia Scarlett | Last updated: October 17, 2026 | License: CC BY 4.0
Axis Intelligence Research finds that goods from Brazil and China carry the heaviest country-specific U.S. tariff stack in October 2026: up to 37.5 percentage points on top of the ordinary duty for non-exempt products. The European Union and Taiwan sit at the other end, capped at 10% all-in under the July 24, 2026 Section 301 forced-labor action (USTR).
Quick Answer
U.S. tariff rates by country now depend on four layers: the ordinary MFN duty, a Section 301 forced-labor tariff of 10% or 12.5% on 60 economies (effective July 24, 2026), sector duties under Section 232 (steel, aluminum, copper, autos, lumber, chips, drugs), and country-specific actions on China, Brazil and Canada. Axis Intelligence Research’s Origin Duty Stack (ODS) ranges from 0% (economies outside the 60) to 37.5% (Brazil, and China at its upper bound). Importers actually pay far less than the headline: the Headline Collection Ratio (HCR) runs from 18% (Ireland) to 58% (Vietnam) in August 2026.
For the national picture — effective rate, customs revenue, IEEPA refunds — see our tariff statistics 2026 report. This page is the country lookup.
Key Findings
- Axis Intelligence Research finds that 64.5% of 2025 U.S. imports from the 20 largest supplier economies came from origins whose Origin Duty Stack (ODS) is 10%, not 12.5%.
- Axis Intelligence Research calculates an import-weighted ODS of 11.9% to 13.7% across the 20 largest U.S. suppliers, before USMCA claims and product exemptions, using 2025 Census import data.
- Axis Intelligence Research finds that importers paid an effective 3.3% on both Mexican and Canadian goods in August 2026 — about one-third of the 10% headline tier — using Penn Wharton Budget Model customs data.
- Axis Intelligence Research finds that the five net-of-MFN capped economies supplied $1.21 trillion, or 38.5%, of 2025 U.S. imports from the top 20 origins.
- Canada is the only U.S. trading partner facing a country-specific tariff that overrides USMCA: 50% Section 338 duties on select dairy, alcohol and vehicle goods, in force since August 22, 2026, according to CRS.
What Is the U.S. Tariff Rate for Each Country in 2026?
There is no longer one “country rate.” Since the Supreme Court ruled on February 20, 2026 that IEEPA does not authorize tariffs, and since the 150-day, 10% Section 122 surcharge expired on July 24, 2026 (CRS R49481), the duty on any import is the sum of layers that each apply to a different slice of trade.
The layer that now defines most country rates is the Section 301 forced-labor action. USTR found that all 60 investigated economies failed to impose and effectively enforce a ban on goods made with forced labor, and imposed tariffs on “all products” of each economy, with exemptions listed in Annexes I and II (USTR Federal Register notice). The rate depends on whether the economy has a forced-labor import ban, an Agreement on Reciprocal Trade commitment, or a partial regime.
U.S. tariff rates by country: Section 301 forced-labor tiers (effective July 24, 2026)
| Tier | How the rate works | Economies | Count | Source |
|---|---|---|---|---|
| 10% flat | 10% added on top of the MFN duty | Argentina, Bangladesh, Cambodia, Canada, Ecuador, El Salvador, Guatemala, Honduras, India, Indonesia, Jordan, Malaysia, Mexico, Pakistan, Sri Lanka, Trinidad and Tobago, United Kingdom | 17 | USTR |
| 10% all-in cap | MFN + 301 = 10%; zero 301 duty if MFN ≥ 10% | European Union, Taiwan | 2 | USTR |
| 12.5% all-in cap | MFN + 301 = 12.5%; zero 301 duty if MFN ≥ 12.5% | Japan, South Korea, Switzerland | 3 | USTR |
| 12.5% flat | 12.5% added on top of the MFN duty | Algeria, Angola, Australia, The Bahamas, Bahrain, Brazil, Chile, China, Colombia, Costa Rica, Dominican Republic, Egypt, Guyana, Hong Kong, Iraq, Israel, Kazakhstan, Kuwait, Libya, Morocco, New Zealand, Nicaragua, Nigeria, Norway, Oman, Peru, Philippines, Qatar, Russia, Saudi Arabia, Singapore, South Africa, Thailand, Türkiye, United Arab Emirates, Uruguay, Venezuela, Vietnam | 38 | USTR |
| No country tariff | MFN only (plus any Section 232 sector duty) | Every economy not named in the notice | — | USTR |
Three exemptions decide whether a shipment pays any of this. Products covered by Section 232 are excluded from the forced-labor duty. USMCA-qualifying goods from Canada and Mexico are exempt (CRS R49481). And USTR exempted an additional 471 products in its final action — from pig iron and aluminum scrap to unflavored instant coffee, certain semiconductor manufacturing equipment and certain pharmaceutical ingredients — on top of the list it proposed in June (USTR notice).
What does “net of MFN” mean for Japan, Korea, the EU and Taiwan?
It means the Section 301 rate is a ceiling on the combined duty, not an add-on. A Japanese product with a 4% MFN duty pays 8.5% under Section 301, for 12.5% all-in. A Japanese product whose MFN duty is already 15% pays no Section 301 duty at all and stays at 15%. The same arithmetic applies to the EU and Taiwan at 10%. USTR states the cap is designed to be consistent with each economy’s Agreement on Reciprocal Trade or similar arrangement (USTR notice).
Mia Scarlett — analyst commentary. Read the tier table the way you would read a rate card with footnotes, because the footnotes carry most of the value. A 12.5% headline on Japan and a 12.5% headline on Vietnam are not the same number. Japan’s is a cap that absorbs the MFN duty; Vietnam’s sits on top of it. For any HTS line already carrying a double-digit MFN duty, the gap between the two treatments can be the entire margin on the order. The procurement question is no longer “which country is cheaper to tariff” but “which country’s cap is higher than my HTS line’s MFN rate.”
What Is the Origin Duty Stack (ODS)?
Origin Duty Stack (ODS) is an Axis Intelligence Research metric: the country-specific tariff, in percentage points, that a non-exempt product of a given origin pays on top of a 0% MFN duty when it is not covered by Section 232. It isolates what the country of origin adds, separate from what the product adds.
Formula: ODS = Section 301 forced-labor rate (or all-in cap, at MFN 0%) + Section 301 Brazil duty (25%, Brazil only) + legacy Section 301 China duty (7.5% to 25%, China only)
Inputs come from USTR’s forced-labor notice, the Brazil action published at 91 FR 45516, and CRS’s summary of the 2018–2019 China actions, which applied rates of 7.5% to 25% to about $370 billion of imports (CRS IF12990). The Brazil notice states that covered goods generally remain subject to other Chapter 99 duties, and CRS’s China average adds the 12.5% forced-labor tariff to the older Section 301 actions.
Origin Duty Stack by country, October 2026
| Origin | 2025 U.S. goods imports | ODS (MFN 0%, non-exempt, non-232) | Layers | Sources |
|---|---|---|---|---|
| European Union | $632.9 billion | 10.0% | 301 forced labor, all-in cap | Census; USTR |
| Mexico | $534.3 billion | 10.0% (0% if USMCA-qualifying) | 301 forced labor | Census; USTR |
| Canada | $381.9 billion | 10.0% (0% if USMCA-qualifying) + 50% Section 338 on select goods | 301 forced labor; Section 338 | Census; USTR; CRS |
| China | $308.7 billion | 20.0% – 37.5% | 301 forced labor + legacy 301 | Census; USTR; CRS |
| Taiwan | $201.4 billion | 10.0% | 301 forced labor, all-in cap | Census; USTR |
| Vietnam | $193.9 billion | 12.5% | 301 forced labor | Census; USTR |
| Japan | $145.8 billion | 12.5% | 301 forced labor, all-in cap | Census; USTR |
| South Korea | $125.5 billion | 12.5% | 301 forced labor, all-in cap | Census; USTR |
| Switzerland | $106.2 billion | 12.5% | 301 forced labor, all-in cap | Census; USTR |
| India | $103.8 billion | 10.0% | 301 forced labor | Census; USTR |
| Thailand | $91.3 billion | 12.5% | 301 forced labor | Census; USTR |
| United Kingdom | $64.8 billion | 10.0% | 301 forced labor | Census; USTR |
| Malaysia | $59.5 billion | 10.0% | 301 forced labor | Census; USTR |
| Brazil | $39.9 billion | 37.5% | 301 forced labor + 301 Brazil | Census; USTR; Federal Register |
| Singapore | $38.2 billion | 12.5% | 301 forced labor | Census; USTR |
| Indonesia | $34.6 billion | 10.0% | 301 forced labor | Census; USTR |
| Australia | $29.0 billion | 12.5% | 301 forced labor | Census; USTR |
| Israel | $20.7 billion | 12.5% | 301 forced labor | Census; USTR |
| Philippines | $17.8 billion | 12.5% | 301 forced labor | Census; USTR |
| Cambodia | $15.3 billion | 10.0% | 301 forced labor | Census; USTR |
| Any economy outside the 60 | — | 0.0% | MFN only | USTR |
Import values: full-year 2025 goods imports from each U.S. Census Bureau country page (China shown; each row links to its own country code in the CSV). All 20 economies, the formula and every input are in the CSV.
These 20 origins supplied $3.15 trillion of the $3.41 trillion in 2025 U.S. goods imports — 92.1% of the total (Census, world total).
Where do U.S. imports sit on the duty stack?
Axis Intelligence Research grouped 2025 imports from the top 20 origins by ODS band:
| ODS band | 2025 imports from top-20 origins | Share | Calculation |
|---|---|---|---|
| 10% | $2,028.5 billion | 64.5% | EU, Mexico, Canada, Taiwan, India, UK, Malaysia, Indonesia, Cambodia |
| 12.5% | $768.4 billion | 24.4% | Vietnam, Japan, Korea, Switzerland, Thailand, Singapore, Australia, Israel, Philippines |
| 20% – 37.5% | $308.7 billion | 9.8% | China |
| 37.5% | $39.9 billion | 1.3% | Brazil |
Import-weighted ODS: Σ(2025 imports × ODS) ÷ Σ(2025 imports) = 11.9% with China at its 20% lower bound, 13.7% at its 37.5% upper bound.
USMCA-adjusted estimate: the Penn Wharton Budget Model reports that 81.4% of Canadian and Mexican import value claimed USMCA treatment in August 2026. Applying that share to the Canada and Mexico rows (10 × (1 − 0.814) = 1.86%) lowers the import-weighted ODS to 9.6%–11.3%. Axis Intelligence Research labels this an estimate: it applies an August 2026 claim rate to a 2025 import base.
Mia Scarlett — analyst commentary. The weighted number tells you something the tier list hides. By headcount, 41 of the 60 economies sit at 12.5% or its cap. By dollars, nearly two-thirds of what America buys from its largest suppliers sits at 10%. That is not an accident of geography — the 10% tier holds the EU, Mexico, Canada and Taiwan, which between them are most of the import book. The policy reads as broad. The bill lands narrow.
How Much of the Headline Tariff Do Importers Actually Pay?
The headline rate is what the law says. The effective rate is what customs collected. Penn Wharton Budget Model publishes effective rates — duties collected divided by import value — for six major origins from USITC DataWeb customs data (PWBM, October 14, 2026). August 2026 is the first full month under the Section 301 forced-labor tariffs, which makes it the cleanest month to set the two side by side.
Headline Collection Ratio (HCR) is an Axis Intelligence Research metric: the effective tariff rate an origin paid in a month, divided by its Origin Duty Stack (ODS). An HCR of 100% would mean importers paid the full country headline on average. An HCR well below 100% measures how much of that origin’s trade escapes the headline through USMCA claims, Annex exemptions, Section 232 coverage, or low-tariff product mix.
Formula: HCR = PWBM effective tariff rate (month) ÷ ODS × 100
Headline vs. collected U.S. tariff rate by country, August 2026
| Origin | ODS (headline) | Effective rate, Aug 2026 | Effective rate, Jan 2025 | HCR | Sources |
|---|---|---|---|---|---|
| Vietnam | 12.5% | 7.21% | 3.56% | 57.7% | PWBM; USTR |
| Canada | 10.0% | 3.31% | 0.12% | 33.1% | PWBM; USTR |
| Mexico | 10.0% | 3.26% | 0.28% | 32.6% | PWBM; USTR |
| Switzerland | 12.5% (all-in cap) | 3.40% | 0.12% | 27.2% | PWBM; USTR |
| Ireland (EU member) | 10.0% (all-in cap) | 1.80% | 0.11% | 18.0% | PWBM; USTR |
| China | 20.0% – 37.5% | 24.26% | 10.67% | 64.7% – 121.3% | PWBM; USTR; CRS |
| All origins | 11.9% – 13.7% (top-20 weighted) | 7.13% | 2.28% | 52.2% – 59.7% (estimate) | PWBM; Axis Intelligence Research |
Effective rates from PWBM’s October 14, 2026 data file (Figures 1 and 2.1), shown to two decimals. HCR calculations: Axis Intelligence Research. The all-origins HCR divides a monthly effective rate by an ODS weighted on 2025 imports, so it is labeled an estimate.
Three readings stand out. China is the only origin with an HCR that can exceed 100%, because its effective rate also captures Section 232 duties and the 2024 Section 301 increases of 25%–100% that sit outside ODS. Ireland’s 18.0% is the lowest of the six, the clearest case of an all-in cap absorbing the MFN duty rather than adding to it. Switzerland’s effective rate fell from 5.72% in June 2026 to 3.40% in August, the first full month after the 10% Section 122 surcharge gave way to its 12.5% net-of-MFN cap.
The USMCA split explains North America’s one-third ratio. PWBM’s data file shows 79.7% of Canadian and 83.1% of Mexican import value claimed USMCA treatment in August 2026, up from 34.3% and 45.1% in January 2025.
Mia Scarlett — analyst commentary. HCR is the number a landed-cost model should start from, and the spread between origins is the point. A Vietnamese supplier hands over more than half its headline; a Swiss or Irish supplier hands over a quarter or less. That gap is not tariff policy being lenient — it is product mix and paperwork doing the work. Canadian importers more than doubled their USMCA claim rate since January 2025 and Mexican importers nearly did — a compliance cost booked to save a duty cost. When the joint review rewrites the rules of origin, that is the line that reprices first.
Is the weighted headline above what the U.S. collects overall?
Yes. Axis Intelligence Research’s top-20 import-weighted ODS of 11.9%–13.7% compares with an all-origin effective rate of 7.13% in August 2026. The two measure different things, so they are shown side by side rather than combined: ODS is a statutory headline for one class of goods, while the effective rate includes MFN and Section 232 duties after every exemption. Our tariff statistics report tracks the collected-rate series month by month.
What Is the Base U.S. Tariff Rate Before Section 301 and 232?
The base layer is the Most-Favored-Nation (MFN) rate in the Harmonized Tariff Schedule, and it is thin. The WTO tariff profile for the United States puts the simple average MFN applied rate at 3.3% and the trade-weighted average at 2.2% (2022, the latest year in the profile [older data] — the MFN schedule itself has changed little; the 2025–2026 changes all sit in Chapter 99). Agricultural lines average 5.1%, non-agricultural 3.1%.
That is why the forced-labor tier, not the MFN line, now drives most country comparisons: a 10% or 12.5% Section 301 layer is 4.5 to 5.7 times the 2.2% trade-weighted MFN average.
What Are the Section 232 Tariff Rates by Product and Country?
Section 232 duties apply by product, to nearly every origin, and they override the forced-labor tariff: a product inside Section 232 coverage pays the 232 rate and is exempt from the Section 301 forced-labor duty. This is the layer where country deals matter most.
Section 232 tariff rates in force (as of September 30, 2026)
| Product | Rate | Country-specific treatment | Source |
|---|---|---|---|
| Steel and aluminum articles (Annex I-A) | 50% on full value | UK: 25% with ≥95% UK-melted/smelted content | CRS IN12519 |
| Steel/aluminum derivatives, certain copper (Annex I-B) | 25% on full value | UK: 15% with ≥95% UK content | CRS IN12519 |
| Certain steel derivatives (Annex I-C, through Dec 31, 2027) | 25% | MFN + 232 = 15% for Argentina, Ecuador, El Salvador, Guatemala, Japan, South Korea, Liechtenstein, Switzerland, Taiwan, UK, EU | CRS IN12519 |
| Derivatives with ≥85% U.S.-sourced metal | 10% | All origins | CRS IN12519 |
| Russian aluminum | 200% | Russia only | CRS IN12519 |
| Copper (semi-finished, intensive derivatives) | 10% – 50% | Varies by product | CRS R49481 |
| Automobiles and parts | 15% – 25% | EU, Japan, South Korea: 15% all-in; UK: 10% for most auto imports; USMCA exceptions | CRS IN12545 |
| Medium/heavy trucks and parts | 25% | Some USMCA exceptions | CRS R49481 |
| Buses | 10% | Global | CRS R49481 |
| Timber, lumber and derivatives | 10% – 25% | Increase for certain products scheduled Jan 1, 2027 | CRS R49481 |
| Certain semiconductors and derivatives | 25% | Global | CRS R49481 |
| Patented pharmaceuticals and ingredients | 10% – 100% | Varies by country | CRS R49481 |
| Drones (>25 kg) | 10% – 100% | Varies by product and country | CRS R49481 |
| Polysilicon and derivatives | 10% – 15% + minimum import prices | Effective December 4, 2026 | CRS R49481 |
Two thresholds trim the metals net. Goods in Annex I-B or Annex III outside HTS chapters 72–76 escape Section 232 if steel, aluminum and copper make up less than 15% of their weight, and Section 232 metals duties apply to USMCA-compliant goods (CRS IN12519). PWBM measures the result: steel and aluminum products carried a 39.8% effective rate in August 2026, automotive vehicles 13.8%.
Mia Scarlett — analyst commentary. The 232 table is where the deal map shows through. The EU, Japan and Korea paid for a 15% auto ceiling; the UK paid for 10% autos and half-rate metals tied to UK melt-and-pour. None of that appears in the forced-labor tier list, and none of it helps Vietnam or Thailand, which have no 232 side letter. A buyer comparing a Korean and a Thai supplier of a steel-intensive assembly is comparing a 15% capped line against a 25% derivative rate before anyone mentions forced labor. That is the line item that moves the quote.
What Is the U.S. Tariff Rate on Canada and Mexico Under USMCA?
USMCA-qualifying goods from Canada and Mexico are exempt from the 10% forced-labor tariff. Non-qualifying goods pay it. That split makes USMCA rules of origin the difference between 0% and 10% on most North American trade — and PWBM shows importers acting on it, with 81.4% of Canadian and Mexican import value claiming USMCA treatment in August 2026.
Canada has a layer Mexico does not. Under Section 338 of the Tariff Act of 1930, used for the first time, the President imposed 50% duties on select Canadian dairy, alcoholic beverages and motor vehicles (White House proclamation). The duties took effect on August 22, 2026, carry no USMCA exemption, and from September 15 a list including some Section 232 items stacks with 232 duties up to 100% on certain products (CRS R49349). Canada answered with counter-tariffs on about US$20 billion (C$27.6 billion) of U.S. goods from September 8.
Canada tariff stack by scenario (October 2026)
| Canadian product | U.S. duty layers | Total additional duty | Source |
|---|---|---|---|
| USMCA-qualifying good, not on any list | None | 0% | USTR; CRS R49481 |
| Non-qualifying good, MFN 0%, non-232 | 301 forced labor | 10% | USTR |
| Dairy, alcohol or vehicle good on the Section 338 list | Section 338 (USMCA irrelevant) | 50% | CRS R49349 |
| Steel or aluminum article (Annex I-A) | Section 232 | 50% | CRS IN12519 |
| Section 232 item added to the Sept 15 Section 338 list | Section 232 + Section 338 | up to 100% | CRS R49349 |
| Softwood timber and lumber | Section 232 | 10% | CRS IF12595 |
The USMCA itself is in play. CRS reports that at the July 2026 joint review, the administration declined to extend the agreement in its current form (CRS IN12519). Every 0% line in the table above depends on that outcome.
What Is the U.S. Tariff Rate on China in 2026?
China carries four layers at once: the MFN duty, the 12.5% forced-labor tariff, the legacy Section 301 tariffs of 7.5% to 25% from 2018–2019, and the 2024 increases of 25% to 100% on selected goods such as electric vehicles and semiconductors (CRS IF12990). CRS approximates the average U.S. tariff on Chinese goods at about 36.5% after the forced-labor action — an unweighted figure that does not account for exemptions or Section 232.
What importers actually paid was lower. PWBM measures China’s effective rate at 24.3% in August 2026, still the highest among major U.S. trading partners. Our China EV export statistics and China rare earth statistics cover the supply side.
U.S. imports from China reached $183.5 billion in January–August 2026, against $308.7 billion for all of 2025 (Census).
What Is the U.S. Tariff Rate on Brazil?
Brazil is the only economy besides China with two country-specific Section 301 layers. A 25% Section 301 duty on goods of Brazil took effect on July 22, 2026, with exemptions for civil aircraft, pharmaceutical uses, donations, informational materials and anything covered by Section 232 (91 FR 45516). Two days later, Brazil entered the 12.5% forced-labor tier. A non-exempt Brazilian good with a 0% MFN duty therefore carries an ODS of 37.5%.
Mia Scarlett — analyst commentary. Brazil’s number is the cleanest illustration of why a single “country rate” misleads. On paper Brazil is the most tariffed origin on this page. In practice, civil aircraft, pharmaceutical uses and every Section 232 product route around the Brazil duty, and the forced-labor annexes add pig iron, aluminum hydroxide and instant coffee to the exempt list. The 37.5% is real for a non-exempt good. Whether it is real for your good is an HTS-line question, not a country question.
Which Countries Have No Additional U.S. Tariff in 2026?
Any economy not among the 60 named in USTR’s notice faces no country-specific U.S. tariff. Its goods pay the MFN rate, plus Section 232 duties if the product falls into a covered sector, plus antidumping or countervailing duties where an order exists. Economies such as Ukraine, Ghana, Kenya and Côte d’Ivoire are not on the list. No de minimis relief applies anywhere: duty-free de minimis treatment remains suspended globally (CRS R49481) — see our de minimis threshold by country dataset and cross-border e-commerce statistics for the parcel channel.
Which U.S. Tariffs Could Change Next?
Rates on this page are a snapshot. CRS lists the actions still open as of September 30, 2026 (CRS R49481):
| Pending action | Authority | Countries | Status |
|---|---|---|---|
| Structural excess capacity in manufacturing | Section 301 | Multi-country | Investigation initiated March 2026 |
| Germany’s underpayment for innovative pharmaceuticals | Section 301 | Germany | Investigation initiated June 2026 |
| Vietnam’s IP protection and enforcement | Section 301 | Vietnam | Investigation initiated May 2026 |
| China’s Phase One compliance | Section 301 | China | Investigation initiated October 2025 |
| Robotics and industrial machinery | Section 232 | TBD | Investigation initiated September 2025 |
| PPE, medical consumables and equipment | Section 232 | TBD | Investigation initiated September 2025 |
| Wind turbines and parts | Section 232 | TBD | Investigation initiated August 2025 |
| Anthracite coal | Section 232 | TBD | Investigation initiated June 2026 |
| Polysilicon minimum import prices | Section 232 | Global | Effective December 4, 2026 |
USTR also has to build the cotton and textile tariff-rate quotas for Bangladesh, Cambodia, Indonesia and Malaysia, with an initial three-year duration, which will let a set volume of apparel enter free of the forced-labor duty (USTR notice).
Methodology
Collection. Axis Intelligence Research collected every rate on this page from primary or official documents retrieved on October 17, 2026: USTR’s final Federal Register notice and press release for the forced-labor Section 301 action (July 23, 2026); the Brazil Section 301 notice (91 FR 45516); Congressional Research Service products R49481 (current as of September 30, 2026), IN12519 (September 17, 2026), IN12545 (May 7, 2026), IF12990 (August 14, 2026), IF12595 and R49349 (September 14, 2026); the White House Section 338 proclamation; the Penn Wharton Budget Model update of October 14, 2026; the WTO tariff profile for the United States; and U.S. Census Bureau country trade pages for 2025 and January–August 2026 imports. Each figure is a CSV row with its URL and retrieval date.
Origin Duty Stack (ODS). ODS = Section 301 forced-labor rate (or the all-in cap, evaluated at MFN 0%) + Brazil Section 301 (25%) where applicable + legacy China Section 301 (7.5%–25%) where applicable. ODS applies to a product that is non-exempt under Annexes I–II, outside Section 232 coverage, and carries a 0% MFN duty. For a product with MFN duty m: flat-tier economies pay m + ODS; capped economies pay max(m, cap).
Import-weighted ODS. Σ(2025 Census imports × ODS) ÷ Σ(2025 Census imports) across the 20 largest origins (92.1% of 2025 U.S. goods imports). China enters at 20% (lower bound) and 37.5% (upper bound). The USMCA-adjusted estimate multiplies the Canada and Mexico ODS by (1 − 0.814), using PWBM’s August 2026 USMCA claim share.
Headline Collection Ratio (HCR). HCR = PWBM effective tariff rate for an origin in a given month ÷ that origin’s ODS × 100. PWBM publishes origin-level effective rates for China, Mexico, Canada, Ireland, Switzerland and Vietnam; HCR is reported for those six plus the all-origin average. Inputs come from PWBM’s October 14, 2026 data file.
Reading the numbers. ODS is a statutory headline for non-exempt goods, not a collected rate; PWBM’s effective rate is the collected measure and is shown alongside, never merged. The 2025 import base predates the July 2026 rate changes and reflects the 2025 sourcing mix. The CRS China average (36.5%) is an unweighted approximation reported as published. EU imports are counted as one origin, consistent with USTR’s treatment of the EU as one economy.
About This Dataset
U.S. Tariff Rates by Country 2026 — 436 rows covering the Section 301 forced-labor rate for all 60 economies, Brazil and China Section 301 layers, Section 232 rates by product with country-specific treatment, Section 338 duties on Canada, the U.S. MFN base, 2025 and January–August 2026 U.S. imports for the 20 largest origins, PWBM monthly effective tariff rates (January 2025–August 2026) for six origins and all imports, USMCA claim shares, product-level effective rates, and the Axis Intelligence Research Origin Duty Stack (ODS) and Headline Collection Ratio (HCR) readings. Every row carries value, unit, as-of date, source organization, document, URL, retrieval date, a primary-source flag, and whether the figure is Axis-calculated (with method note).
- File:
tariff-rates-by-country.csv(UTF-8, comma-separated, long format) - License: CC BY 4.0 — reuse freely with attribution to Axis Intelligence Research
- Updates: relevance-driven. This page is revised when USTR modifies a Section 301 action or its annexes, a Section 232 proclamation changes a rate or country treatment, the Section 338 Canada list changes, the USMCA joint review concludes, or a pending investigation produces a tariff.
- Mirrors: Hugging Face, Kaggle and GitHub (Axis Intelligence Research organization pages)
How to Cite This Data
APA: Axis Intelligence Research. (2026, October 17). U.S. tariff rates by country 2026: The full duty stack for every major trading partner. Axis Intelligence. https://axis-intelligence.com/tariff-rates-by-country/
MLA: Axis Intelligence Research. “U.S. Tariff Rates by Country 2026: The Full Duty Stack for Every Major Trading Partner.” Axis Intelligence, 17 Oct. 2026, axis-intelligence.com/tariff-rates-by-country/.
Chicago: Axis Intelligence Research. “U.S. Tariff Rates by Country 2026: The Full Duty Stack for Every Major Trading Partner.” Axis Intelligence, October 17, 2026. https://axis-intelligence.com/tariff-rates-by-country/.
Short citation for charts and press: “Source: Axis Intelligence Research, U.S. Tariff Rates by Country 2026 (Origin Duty Stack, Headline Collection Ratio).”
Country Tariff Questions Importers and Customs Brokers Are Asking
Does a USMCA claim still make Canadian and Mexican goods duty-free?
For most goods, yes. USMCA-qualifying goods are exempt from the 10% Section 301 forced-labor tariff. Two exceptions: Section 232 metals duties apply to USMCA-compliant goods, and Canada’s Section 338 duties of 50% on select dairy, alcohol and vehicle goods apply regardless of USMCA (CRS, September 2026).
Why does a Japanese or Korean product pay 12.5% when its normal duty is 4%?
Japan, South Korea and Switzerland are capped “net of MFN”: the Section 301 duty tops the total up to 12.5%. A product with a 4% MFN rate pays 8.5% under Section 301. If the MFN rate is 12.5% or higher, the Section 301 duty is zero (USTR, July 23, 2026).
Is the EU tariff rate 10% or 15%?
Both, for different goods. Most EU products face a 10% all-in cap under the Section 301 forced-labor action. EU automobiles face a 15% all-in Section 232 rate, and certain steel derivatives a 15% all-in rate through 2027. Steel and aluminum articles pay 50%.
Does the 12.5% forced-labor tariff stack on Section 232 steel or auto duties?
No. USTR exempts all articles and parts subject to Section 232 tariffs from the forced-labor Section 301 duty. A Vietnamese steel article pays the 50% Section 232 rate, not 50% plus 12.5%.
What is the highest country-specific U.S. tariff stack in 2026?
Brazil and China. Axis Intelligence Research’s Origin Duty Stack (ODS) reaches 37.5% for non-exempt Brazilian goods (25% Brazil 301 + 12.5% forced labor) and 20%–37.5% for Chinese goods, before China’s 2024 increases of 25%–100% on select products.
What tariff applies to a country not on USTR’s list of 60?
Only the MFN duty from the Harmonized Tariff Schedule, plus any Section 232 sector duty and any antidumping or countervailing order. The U.S. trade-weighted MFN average is 2.2% (WTO, 2022 data). De minimis duty-free treatment remains suspended for all origins.
Which country has the lowest U.S. tariff in 2026?
Among the 60 economies, the EU and Taiwan carry the lowest headline at a 10% all-in cap, and USMCA-qualifying goods from Canada and Mexico pay 0%. Economies outside the 60 pay only MFN duties, which average 3.3% on a simple basis (WTO).
How much tariff do importers actually pay on Mexican, Canadian or Vietnamese goods?
Less than the headline. In August 2026, importers paid an effective 3.26% on goods from Mexico, 3.31% from Canada and 7.21% from Vietnam (PWBM). Axis Intelligence Research’s Headline Collection Ratio puts that at 32.6%, 33.1% and 57.7% of each origin’s headline Section 301 rate.
When can the forced-labor tariff tier for a country change?
When an economy adopts or effectively enforces a forced-labor import ban. Cambodia, Guatemala, Honduras, India, Sri Lanka and Trinidad and Tobago moved to the 10% tier by adopting bans after June 5, 2026; Jordan did so through an Agreement on Reciprocal Trade commitment (USTR).