

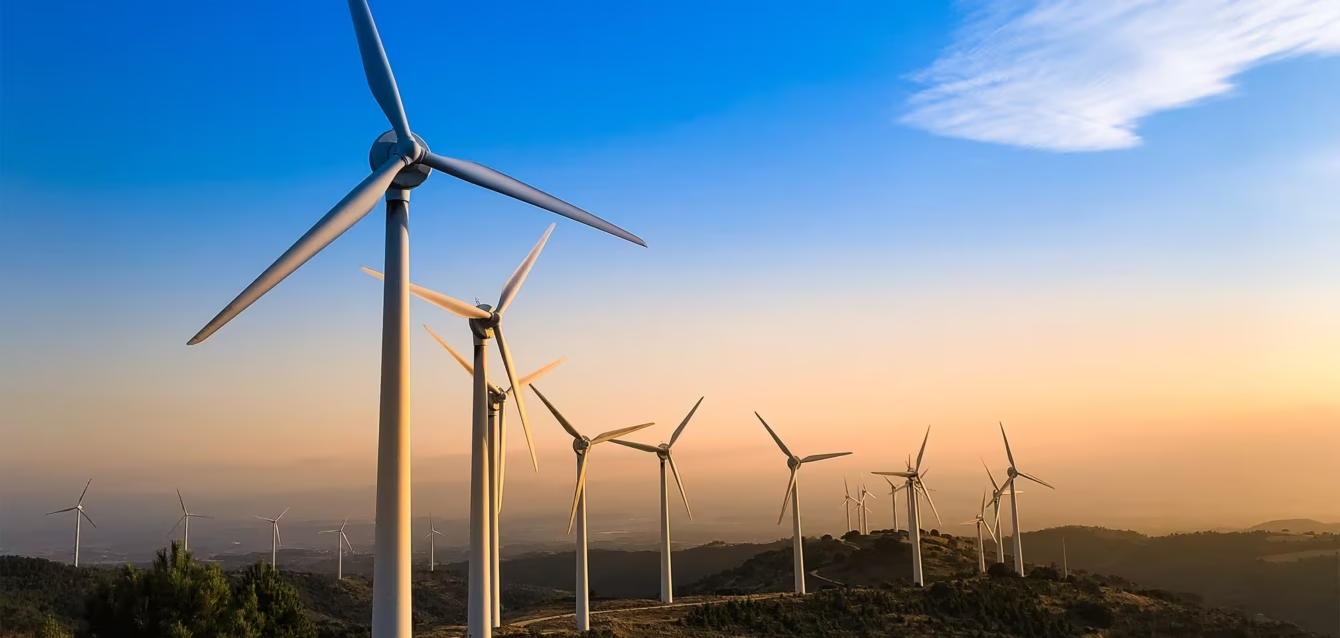
Wind Energy Statistics 2026
By Axis Intelligence Research
Co-author: Aidan Jad | Last updated: August 14, 2026 | License: CC BY 4.0
The world’s wind fleet crossed 1,291 GW of installed capacity at the end of 2025 and produced 2,715 TWh of electricity — 8.5% of all power generated on Earth. Capacity grew 14.0% that year. Output grew 8.2%. That six-point gap between what was built and what was delivered is the most important number in wind energy this year, and almost nobody is reporting it.
Quick Answer
Global wind energy capacity reached 1,291 GW at end-2025, generating 2,715 TWh — 8.5% of world electricity, per IRENA and Ember. Axis Intelligence Research calculates a global Wind Capacity Conversion Rate (WCCR™) of 25.6%: the world’s wind fleet delivered roughly a quarter of its theoretical maximum output. Outside China, that figure rises to 28.6%.
Key Findings
- Global wind generation reached 2,715 TWh in 2025, up 205 TWh or 8.2% from 2024, according to Ember’s Global Electricity Review 2026.
- Installed wind capacity worldwide stood at 1,291 GW at the end of 2025 after record additions of 158.7 GW, according to IRENA’s Renewable Capacity Statistics 2026.
- Axis Intelligence Research finds the global Wind Capacity Conversion Rate (WCCR™) was 25.6% in 2025, against 28.6% for the world excluding China and 22.3% for China alone.
- Axis Intelligence Research finds China held 49.6% of world wind capacity at end-2025 but produced 41.8% of world wind electricity — a 7.8-point gap between installed share and delivered share.
- The global weighted-average levelised cost of onshore wind fell to USD 33/MWh in 2025, making it the cheapest source of new electricity, according to IRENA’s Renewable Power Generation Costs in 2025.
How Much Wind Energy Is Produced Globally in 2026?
Wind supplied 2,715 TWh of electricity in 2025 — the most recent full year for which reported national data exists — which Ember’s Global Electricity Review 2026 puts at 8.5% of global generation, an all-time high. Wind’s 205 TWh increase was the second-largest of any electricity source last year, behind solar.
The fleet has roughly doubled its output in seven years: 1,268 TWh in 2018 to 2,715 TWh in 2025.
Two things happened in 2025 that reframe how wind should be read. First, solar overtook wind globally for the first time, reaching 2,778 TWh. Second, renewables as a class overtook coal — 10,730 TWh against 10,476 TWh — inside a global electricity system that consumed 31,779 TWh.
| Metric | 2025 value | Source |
|---|---|---|
| Global wind generation | 2,715 TWh | Ember, Global Electricity Review 2026 |
| Change vs 2024 | +205 TWh (+8.2%) | Ember, Global Electricity Review 2026 |
| Wind share of global electricity | 8.5% | Ember, Global Electricity Review 2026 |
| Wind + solar share of global electricity | 17.3% | Ember, Global Electricity Review 2026 |
| Global wind generation, 2018 | 1,268 TWh | Ember, Global Electricity Review 2026 |
| Grid emissions intensity | 458 gCO2e/kWh | Ember, Global Electricity Review 2026 |
Aidan Jad: Wind spent a decade as the default answer to “what replaces coal,” and it just lost that title to a technology with a capacity factor less than half its own. Solar won on installation speed and module price, not on energy delivered per megawatt. Wind’s advantage is that its output profile is nocturnal and seasonal in ways solar’s is not — which is precisely the profile a grid needs once solar has eaten the midday. The interesting question for 2026 is not whether wind falls behind solar in TWh. It has. The question is what the wind fleet is worth per MWh at 3 a.m. in February.
How Much Wind Capacity Is Installed Worldwide?
Installed wind capacity reached 1,291 GW at the end of 2025, up 158.7 GW on the year, per IRENA’s renewable capacity highlights. That is a 14.0% expansion of the stock and a record in absolute terms. Wind now accounts for 25.1% of the world’s 5,149 GW of renewable capacity, second to solar’s 2,392 GW and effectively level with hydropower at 1,296 GW.
The IEA’s Global Energy Review 2026 puts 2025 wind additions at around 160 GW and calls the year-on-year increase “nearly 40%,” which reconciles cleanly with IRENA’s 158.7 GW against 113 GW in 2024. Ember’s separately compiled capacity series reports 167 GW. The three agencies are measuring slightly different things — grid connection date, commissioning date, national reporting cut-offs — and the spread is about 5%. We report all three rather than pick one.
Wind capacity additions by market, 2025
| Market | Wind capacity added | Source |
|---|---|---|
| China | 119.4 GW | IRENA, Renewable Capacity Statistics 2026 |
| India | 6.3 GW | IRENA, Renewable Capacity Statistics 2026 |
| United States | 5.6 GW | Ember, Global Electricity Review 2026 |
| European Union (onshore) | ~13 GW | IEA, Global Energy Review 2026 |
| European Union (offshore) | ~1 GW | IEA, Global Energy Review 2026 |
| World total | 158.7 GW | IRENA, Renewable Capacity Statistics 2026 |
China took 75% of global additions. The next three markets combined — India, the United States, Germany — bring the top four to 82% of world installations, per Ember. Wind deployment is not a global industry with regional variation; it is a Chinese industry with a global fringe.
Offshore versus onshore
Offshore wind accounted for 7.1% of total wind capacity at end-2025, per IRENA. Applied to the 1,291 GW total, Axis Intelligence Research calculates approximately 91.7 GW of offshore capacity against 1,199.3 GW onshore.
Offshore’s year was poor in Europe. EU offshore additions fell to about 1 GW from 1.7 GW in 2024, with only France and Germany connecting new capacity, per the IEA. In the United States, developers reported plans for 5,089 MW of nameplate offshore capacity off New York, Rhode Island and Virginia as of May 2026, according to the EIA.
The Wind Capacity Conversion Rate (WCCR™): An Axis Intelligence Research Metric
Capacity is what gets announced. Generation is what gets paid for. The distance between them is where wind’s economics actually live, and it is not a number the major agencies publish in comparable form.
So we built one.
Definition
WCCR™ (Wind Capacity Conversion Rate) is the percentage of a wind fleet’s theoretical maximum annual output that the fleet actually delivered, measured against the mean capacity available during the year.
WCCR = Generation (TWh) ÷ [ Mean installed capacity (GW) × 8.76 ] × 100

where Mean installed capacity = (capacity at year-start + capacity at year-end) ÷ 2
and 8.76 = TWh produced per GW running continuously for one year (8,760 h ÷ 1,000)
The mean-capacity denominator is the whole point. A fleet that grew 14% in a year never had its year-end capacity available for twelve months. Divide by year-end capacity and you understate performance; divide by year-start capacity and you flatter it. On 2025 world data the same generation figure yields 24.0% on a year-end denominator and 27.4% on a year-start denominator — a 3.4-point swing driven purely by a methodological choice. We publish all three so anyone can reproduce or challenge ours.
2025 readings
| Fleet | Generation | Mean capacity | WCCR™ | Inputs |
|---|---|---|---|---|
| World | 2,715 TWh | 1,211.7 GW | 25.6% | Ember (generation); IRENA (capacity) |
| China | 1,135 TWh | 580.7 GW | 22.3% | Ember (generation); NEA + IRENA (capacity) |
| World excluding China | 1,580 TWh | 631.0 GW | 28.6% | Derived from the two rows above |
As of December 31, 2025. Full inputs and per-row provenance in the downloadable dataset.
What the readings say
Axis Intelligence Research finds a 6.3-percentage-point spread between the non-Chinese wind fleet and the Chinese one. On a relative basis, wind capacity outside China converted nameplate into electricity 1.28 times more effectively than capacity inside it.
That gap has a second expression that is easier to quote. China held 49.6% of world wind capacity at the end of 2025 — approximately half the machines on the planet — and produced 41.8% of world wind electricity. Seven point eight percentage points of installed share did not show up as delivered share.
There are legitimate structural reasons, and they are not all failures. China commissioned 119.4 GW in a single year, much of it late in the year and much of it in “mega-base” projects outside the auction scheme, per the IEA; capacity connected in November contributes almost nothing to that calendar year’s output, and mean-capacity weighting only partially corrects for within-year timing. Chinese wind resource is also concentrated in interior provinces far from load, where curtailment and transmission constraints bite. And China’s onshore wind LCOE of USD 27/MWh — the lowest of any major market, per IRENA — tells you developers there are optimising for capital cost per MW, not for yield per MW. At USD 976/kW globally and less in China, a lower conversion rate can still be the correct commercial answer.
Aidan Jad: This is the wind version of a problem the hydro industry already lived through. Ember notes global hydro capacity is up 43% since 2010 while hydro generation is up 29% — capacity factors quietly eroding underneath a headline that still says “growth.” Wind is now running the same experiment at speed. A 25.6% conversion rate means that for every gigawatt of nameplate a utility signs for, it should plan around roughly 2.24 TWh a year, not the 8.76 TWh the plate says. Get that wrong in an interconnection queue application and the error compounds through every downstream assumption: transmission sizing, storage sizing, the PPA price you can afford to sign. The number to watch through 2026 is not additions. It is whether WCCR holds at 25.6% or keeps drifting down as the good sites fill up.
Which Countries Generate the Most Wind Power?
China generated 1,135 TWh of wind electricity in 2025 — more than the entire G7 combined, at 819 TWh — and accounted for 42% of world wind output, per Ember. Its wind generation rose 138 TWh (+14%) on the year, more than two-thirds of the global increase.
| Country / bloc | Wind generation 2025 | Change vs 2024 | Wind share of own mix | Source |
|---|---|---|---|---|
| China | 1,135 TWh | +138 TWh | — | Ember, Global Electricity Review 2026 |
| United States | 464 TWh | +12.5 TWh | ~10% | EIA; Ember |
| India | 104 TWh | +22 TWh | 5% | Ember, Global Electricity Review 2026 |
| G7 combined | 819 TWh | — | — | Ember, Global Electricity Review 2026 |
| European Union | — | −12 TWh | 17% | Ember, Global Electricity Review 2026 |
| Denmark | — | — | 58% | Ember, Global Electricity Review 2026 |
| Brazil | — | +9.1 TWh | 16% | Ember, Global Electricity Review 2026 |
| Australia | — | +6.5 TWh (+20%) | — | Ember, Global Electricity Review 2026 |
India overtook the United Kingdom in 2025 to become the world’s fifth-largest wind generator. Fifteen countries now generate more than a fifth of their electricity from wind, up from nine in 2020. Denmark leads the world at 58%. Finland leads on a per-capita basis at 4,015 kWh per person.
One source conflict worth naming. On Ember’s dataset the United States produced 17.1% of world wind electricity in 2025 (464 of 2,715 TWh). The EIA’s own international series puts the US share at 20%. The two use different country coverage and different treatment of non-utility generation. We report the EIA figure for US domestic totals and the Ember figure for global shares, and we do not average them, because averaging incompatible methodologies produces a number that means nothing.
United States wind energy statistics
Wind generated 464,000 GWh in the United States in 2025, about 10% of utility-scale generation and 3% more than 2024, per the EIA. Wind holds roughly 12% of US utility-scale generating capacity — a capacity share above its generation share, which is what a sub-100% conversion rate looks like at national level.
Wind projects operate in 43 states. Texas, Iowa, Oklahoma, Kansas and Illinois together produced about 52% of US wind electricity.
Deployment, however, has stalled. US wind installations were 5.1 GW in 2024 and 5.6 GW in 2025 — the lowest two-year stretch in a decade, per Ember — and generation growth slowed to 12.5 TWh, 59% below the 2024 increase.
What Does Wind Energy Cost in 2026?
Onshore wind is the cheapest source of new electricity in the world. IRENA’s Renewable Power Generation Costs in 2025 puts its global weighted-average LCOE at USD 33/MWh, below solar PV at USD 44/MWh. Offshore wind came in at USD 78/MWh.
| Technology | LCOE 2025 | Total installed cost | Capacity factor, new projects | Source |
|---|---|---|---|---|
| Onshore wind | USD 33/MWh | USD 976/kW | 36% | IRENA, RPGC in 2025 |
| Offshore wind | USD 78/MWh | USD 2,931/kW | 41% | IRENA, RPGC in 2025 |
| Solar PV | USD 44/MWh | USD 667/kW | 16% | IRENA, RPGC in 2025 |
Note the capacity-factor column carefully. IRENA’s 36% describes newly commissioned onshore projects — the best machines at the best available sites in their first year. The 25.6% WCCR describes the entire operating fleet, including everything built since the 1990s at sites chosen under older economics. Both are correct. Confusing them is how a business case ends up 40% short.
The regional spread is where the story is. Onshore wind ranges from USD 27/MWh in China to USD 52/MWh in Germany. Offshore is starker: USD 49/MWh in China against USD 141/MWh in the United States — a 2.9× multiple on the same technology. IRENA attributes the developed-market premium to permitting delays, interconnection bottlenecks and higher balance-of-system costs, and notes that country-level macroeconomic conditions explain roughly 2.3 times as much of the variation in financing costs as technology choice does.
Since 2010, onshore wind LCOE has fallen 71% and offshore 63%. IRENA projects a further 20% decline in onshore total installed costs across 2026–2035 — about a third of the reduction delivered in the previous fifteen years — and labels that projection indicative rather than predictive.
Aidan Jad: A 2.9× cost multiple between US and Chinese offshore wind is not a technology gap. The turbines are broadly comparable machines. It is a permitting, financing and supply-chain gap, and it is denominated in years, not dollars — the dollars are the symptom. When IRENA says location explains 2.3 times more cost variance than technology, that is the whole US offshore wind problem in one sentence, and no amount of turbine engineering fixes it.
How Does Wind Energy Compare to Gas for Data Centre Power?
This is the question the AI buildout has forced into every utility planning meeting, and 2025 handed it a genuinely new answer.
IRENA reports that a gas-turbine shortage — driven in part by surging data-centre demand — roughly doubled the capital expenditure for a new combined-cycle plant, to around USD 2,400/kW in the United States, pushing gas LCOE toward USD 100/MWh in high-gas-cost markets like Italy, Germany and Japan. New onshore wind sits at USD 33/MWh. More than 90% of utility-scale renewable projects commissioned in 2025 were cheaper than the cheapest new fossil alternative.
Scale matters here as much as price. Axis Intelligence Research calculates that global wind generation in 2025 was 5.4 times total world data-centre electricity demand, using the IEA’s estimate of roughly 500 TWh for data centres against Ember’s 2,715 TWh for wind. The 2025 increase in wind generation alone — 205 TWh — was 3.4 times the roughly 60 TWh data centres added to global demand that year.
The IEA expects data-centre demand to reach around 950 TWh by 2030. Wind added 205 TWh in a single year.
That does not make wind a drop-in solution for a hyperscale campus. Wind cannot be sited on demand next to a substation the way a gas peaker can, and its output does not match a data centre’s flat 24/7 load without firming. But the framing that data-centre growth requires new gas because renewables cannot keep up does not survive contact with the 2025 numbers.
For the demand side of this equation, see our AI data centre energy consumption statistics and the nuclear capacity hyperscalers have contracted.
Why Did European Wind Generation Fall in 2025?
Wind is the only major generation technology whose annual output can decline while its capacity rises, for reasons no operator controls.
EU wind generation fell 12 TWh in 2025 on unusually low wind speeds, concentrated in the first half of the year. Germany lost 5.6 TWh and Spain 3.4 TWh; Sweden, Poland and Denmark each recorded declines above 1 TWh, per Ember. The IEA’s electricity supply analysis confirms that below-normal European wind speeds tempered global renewable generation growth, and that weak wind and hydro output pushed EU gas-fired generation higher despite record solar.
Wind still supplied 17% of EU electricity in 2025 — double the global average — and the EU’s combined wind and solar share reached 30%, surpassing fossil fuels for the first time.
Australia ran the same experiment in reverse. Its wind generation rose 6.5 TWh (+20%) on better wind conditions plus major new capacity.
Aidan Jad: A resource year is not a trend, and treating one as the other is the most common analytical error in this sector. Two consecutive weak wind years in Northwest Europe would be a signal worth acting on. One is weather. The operational lesson is narrower and more useful: a portfolio built on a single wind regime carries correlated risk across every asset in it, and the hedge is geographic spread or storage — not a better turbine.
Methodology
Data collection. Every figure in this report was retrieved from a primary source document opened and read during the production session on August 14, 2026. Primary sources: IRENA (Renewable Capacity Statistics 2026, published March 31, 2026; Renewable Power Generation Costs in 2025, published July 2026), the IEA (Global Energy Review 2026), Ember (Global Electricity Review 2026, published April 21, 2026), the U.S. Energy Information Administration (Today in Energy, March 20, 2026; Electric Power Monthly; Wind Explained), and the National Energy Administration of China via gov.cn statistical releases. No secondary aggregator was used as the source of any figure.
Reference year. 2025 is the most recent full calendar year with reported national data across all six sources. Where 2026 partial-year data exists it is labelled as such.
WCCR™ formula. WCCR = Generation (TWh) ÷ [mean installed capacity (GW) × 8.76] × 100, where mean installed capacity is the arithmetic mean of year-start and year-end capacity. The constant 8.76 converts one GW of continuous output over 8,760 hours into TWh.
WCCR™ inputs.
- World: generation 2,715 TWh (Ember); capacity 1,291 GW at end-2025 (IRENA); year-start capacity 1,132.3 GW derived as 1,291 − 158.7 GW of IRENA-reported 2025 additions.
- China: generation 1,135 TWh (Ember); capacity 521 GW at end-2024 (NEA, reported as 521 million kW); end-2025 capacity 640.4 GW derived as 521 + 119.4 GW of IRENA-reported 2025 China additions. This derivation is cross-checked against the NEA’s reported combined wind-and-solar stock of 1,840 GW less its reported solar stock of 1,200 GW, which gives 640 GW — a 0.4 GW difference, or 0.06%.
- World excluding China: both generation and capacity computed by subtraction from the two rows above.
Cross-source compatibility. WCCR pairs Ember generation data with IRENA and NEA capacity data. These are independently compiled series with different cut-off conventions. We consider them compatible because both measure grid-connected physical assets and reported metered output, and because IRENA’s China additions figure (119.4 GW) and the NEA’s implied figure (119 GW) agree to within 0.4 GW. Where methodologies do not align — the EIA and Ember figures for the US share of world wind generation, for instance — we publish both side by side and decline to merge them.
Verification. All arithmetic was computed in Python and independently recomputed in exact rational arithmetic in a separate pass, including a reconstruction test confirming each published WCCR reading regenerates its source generation figure to within 0.2 TWh. Every numeric token in this article was matched against a row in the accompanying CSV. Every external URL was fetched and confirmed live before publication.
Scope. WCCR measures delivered output against installed nameplate. It does not decompose the causes — resource quality, curtailment, outages, grid constraints, commissioning timing within the year, or fleet age — and a low reading should not be read as a fault attribution. Mean-capacity weighting corrects for capacity added during the year only on the assumption that additions are distributed evenly across it; in markets with heavy Q4 commissioning, the true reading is somewhat higher than published. Generation series are subject to revision as national statistical agencies finalise data; IRENA revised its 2024 global renewable capacity figure upward by 0.3% between the 2025 and 2026 editions.
About This Dataset
Contents. 101 observations covering global, regional and national wind energy capacity, generation, market share, cost and conversion-rate data for 2025, with 2018, 2020 and 2024 comparison points where relevant. Each row carries value, unit, as-of date, geography, segment, source organisation, source document, source URL, retrieval date, primary-source flag, Axis-calculated flag, method note and licence.
Format. UTF-8 CSV, comma-separated, one header row, ISO 8601 dates, raw numeric values with units in a separate column. Sixteen rows are Axis-calculated; each carries a method note pointing to the formula disclosed above.
Licence. CC BY 4.0. Free to use, reproduce, redistribute and build on, including commercially, with attribution.
Cite this dataset
APA Axis Intelligence Research. (2026). Wind energy statistics 2026: Capacity, generation, and cost data. https://axis-intelligence.com/wind-energy-statistics/
MLA Axis Intelligence Research. “Wind Energy Statistics 2026: Capacity, Generation, and Cost Data.” Axis Intelligence, 14 Aug. 2026, axis-intelligence.com/wind-energy-statistics/.
Chicago Axis Intelligence Research. “Wind Energy Statistics 2026: Capacity, Generation, and Cost Data.” Axis Intelligence, August 14, 2026. https://axis-intelligence.com/wind-energy-statistics/.
WCCR™ attribution Axis Intelligence Research, Wind Capacity Conversion Rate (WCCR™), 2026, axis-intelligence.com/wind-energy-statistics/
Frequently Asked Questions
What is a good capacity factor for a wind farm in 2026?
For a newly commissioned onshore project, IRENA reports a global weighted-average capacity factor of 36% for 2025, and 41% for new offshore projects. Those figures describe new-build at selected sites. The whole operating world fleet delivered a 25.6% Wind Capacity Conversion Rate on Axis Intelligence Research’s calculation. Use the new-build figure for a project pro forma; use the fleet figure for system-level planning.
Why does wind capacity grow faster than wind generation?
Three reasons compound. Capacity commissioned mid-year contributes only a fraction of a full year’s output. New capacity increasingly goes to sites with lower resource quality or higher curtailment exposure as the best sites fill. And annual wind speeds vary — the EU lost 12 TWh in 2025 on weak wind conditions while its capacity rose. In 2025 global capacity grew 14.0% and generation grew 8.2%.
Is offshore wind economically viable outside China?
It depends entirely on the market. IRENA’s 2025 data puts offshore wind LCOE at USD 49/MWh in China and USD 141/MWh in the United States — a 2.9× multiple on comparable hardware. European offshore additions fell to about 1 GW in 2025 from 1.7 GW in 2024. The economics are constrained by permitting timelines, interconnection queues and cost of capital rather than by turbine technology.
How does wind curtailment affect delivered output?
Curtailment — grid operators instructing wind farms to reduce output because transmission or demand cannot absorb it — is one of several factors sitting inside the gap between nameplate and delivered energy. It is most acute where generation is remote from load, which is a structural feature of interior-province Chinese wind and a contributing factor in China’s 22.3% WCCR against 28.6% for the rest of the world. WCCR measures the aggregate gap; it does not isolate curtailment from resource quality, outages or commissioning timing.
Can wind power meet data centre demand growth?
At an aggregate level the arithmetic is not close. Wind’s 2025 generation increase of 205 TWh was 3.4 times the roughly 60 TWh data centres added to global demand that year, and total wind generation was 5.4 times total data-centre demand. At the level of an individual campus it is a different problem: wind cannot be sited to order next to a substation, and its output profile requires firming to serve a flat 24/7 load. Cost is no longer the constraint — new onshore wind at USD 33/MWh sits well below a new US combined-cycle plant at roughly USD 2,400/kW of capex.
Which country has the highest share of wind in its electricity mix?
Denmark, at 58% of national electricity generation in 2025 among countries generating at least 5 TWh of wind, per Ember. Fifteen countries exceeded a 20% wind share in 2025, up from nine in 2020. The EU as a bloc reached 17%, double the global average of 8.5%.
Has US wind deployment stalled?
Installations have. The United States added 5.1 GW in 2024 and 5.6 GW in 2025 — the lowest two-year run in a decade — and wind generation growth slowed to 12.5 TWh in 2025, 59% below the previous year’s increase. Output itself remains near record levels at 464 TWh, roughly 10% of US utility-scale generation across 43 states, with Texas, Iowa, Oklahoma, Kansas and Illinois supplying about 52% of it.
How much cheaper is onshore wind than new gas generation?
IRENA puts new onshore wind at USD 33/MWh globally in 2025. New gas moved the other way: a turbine shortage, driven in part by data-centre demand, roughly doubled combined-cycle capex to around USD 2,400/kW in the United States, and pushed gas LCOE toward USD 100/MWh in high-gas-cost markets including Italy, Germany and Japan. More than 90% of utility-scale renewable capacity commissioned in 2025 undercut the cheapest new fossil alternative.
Will wind costs keep falling?
More slowly. Onshore wind LCOE fell 71% between 2010 and 2025. IRENA projects total installed costs will fall roughly 20% across 2026–2035 — about a third of the previous fifteen years’ reduction — and describes that as indicative rather than predictive. Near-term pressure runs the other way: rising commodity and component prices have been pushing Western onshore turbine prices up, and clean-technology manufacturing investment more than halved between 2023 and the end of 2025.
Related research: Solar Energy Statistics · Nuclear Energy Statistics · AI Data Center Energy Consumption Statistics · Nuclear Energy for Data Centers · AI Data Center Cost per MW · AI Data Center Financing Statistics